
A Spin & Go looks simple from the outside. Three players sit down, a prize multiplier is drawn, and then the game plays out fast. But the multiplier table, your win rate, and the size of the sample all matter at once.
If you want to understand Spin & Go variance, you need three things at once:
- the multiplier table,
- your win rate,
- the size of the sample.
Leave out any one of those, and the result stops meaning what you think it means.
How the prize is drawn
In a Spin & Go, the room draws a multiplier before the table plays. The exact table changes from room to room and can change over time, so never treat one published table as universal.
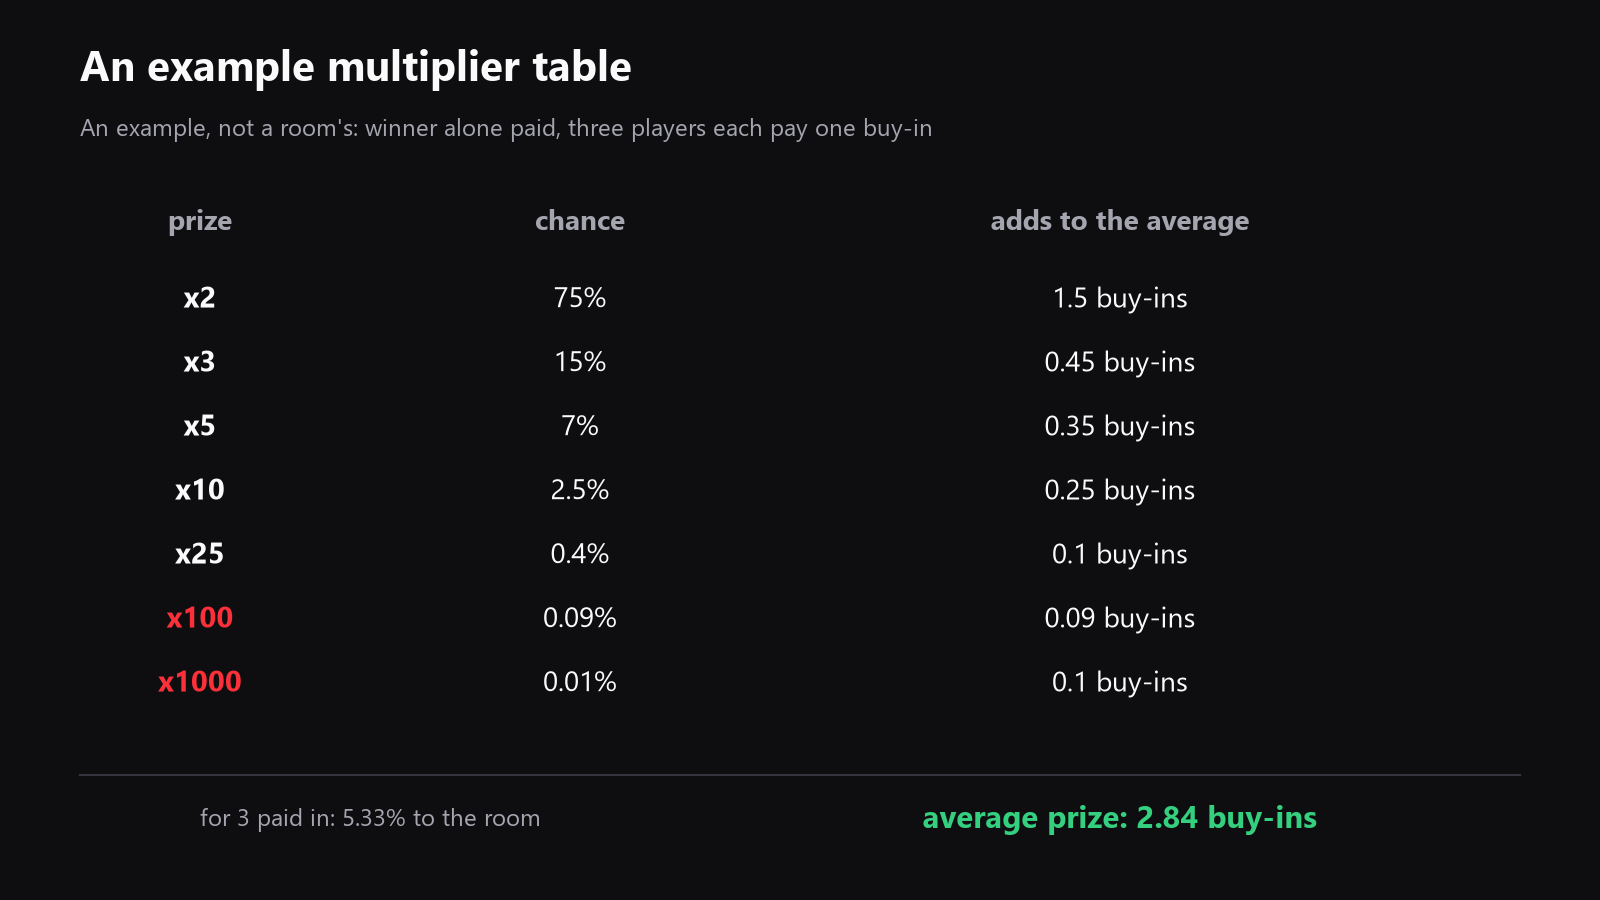
Here is an example table, not a room’s, worked out for a game where the winner takes the whole prize and three players each pay one buy-in:
| Multiplier | Frequency |
|---|---|
| x2 | 75% |
| x3 | 15% |
| x5 | 7% |
| x10 | 2.5% |
| x25 | 0.4% |
| x100 | 0.09% |
| x1000 | 0.01% |
Now turn those rows into the average prize.
- x2: 2 x 75% = 1.50
- x3: 3 x 15% = 0.45
- x5: 5 x 7% = 0.35
- x10: 10 x 2.5% = 0.25
- x25: 25 x 0.4% = 0.10
- x100: 100 x 0.09% = 0.09
- x1000: 1000 x 0.01% = 0.10
Total average prize: 2.84 buy-ins.
Since three players each paid one buy-in, 3 buy-ins went into the pool and 2.84 came back out. The room keeps 0.16 buy-ins on average, which is 5.33%.
That is the rake in Spins. It is not a separate line item at the end. In this example, the rake is built into the multiplier table.
Why the jackpots matter even when they are rare
This is where many players get tripped up.
Expected value and variance are not the same thing.
- Expected value asks, "On average, how much does this row contribute?"
- Variance asks, "How wild are the swings created by this row?"
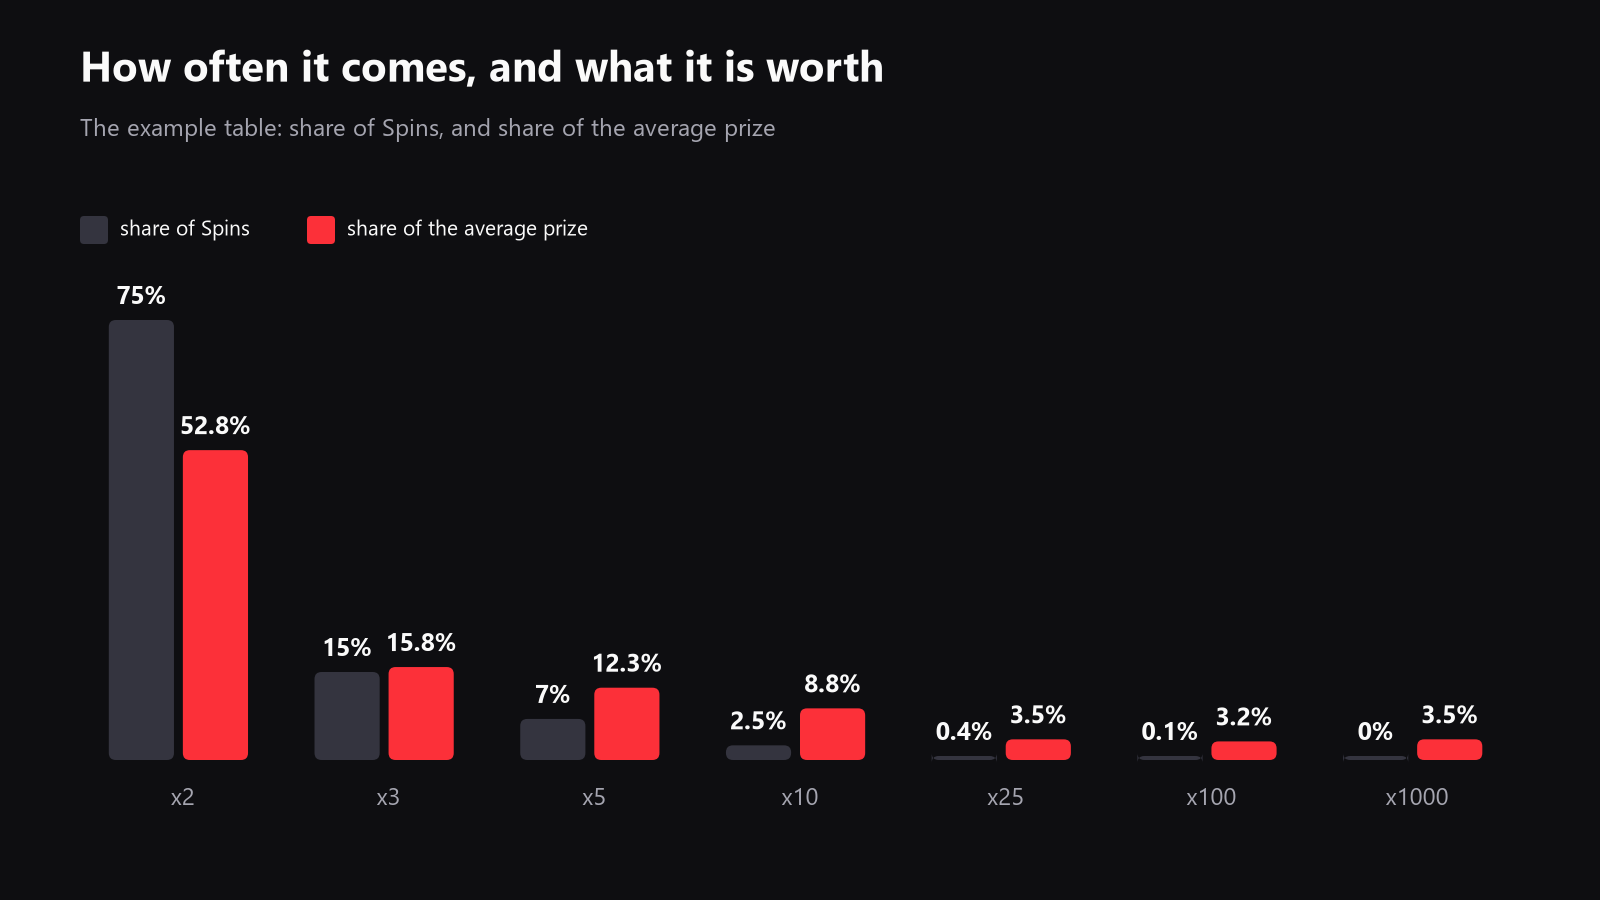
The small multipliers happen most of the time, so they carry most of the average. In this example, x2 alone carries 52.8% of the expected value, because it appears so often.
The huge multipliers are rare, but they are not decoration. They still carry real expected value. In this example, x100 and x1000 together carry 6.7% of the expected value.
That is the key lesson:
- the everyday multipliers build most of the average,
- the big jackpots create a lot of the swing.
So if you ignore jackpots, you do not just simplify the game. You change the game you are measuring.
ROI with and without the jackpots
Spin & Go ROI is just the result of two things multiplied together:
- how often you win,
- how much the average prize pays when you win.
In this example, the average prize is 2.84 buy-ins.
So if your win rate is w, then, assuming you win the same share of Spins at every multiplier:
ROI = 2.84 x w - 1
That gives some useful reference points.
- one third of your Spins won: ROI = minus 5.33%
- 35.2% wins: break even
- 36% wins: ROI = 2.24%
- 38% wins: ROI = 7.92%
This is one of the most important Spin & Go facts to remember: winning one third of your Spins is not break even once rake exists. In this example, you need 35.2% wins just to get back to zero.
Now look at what happens if you never win the x1000.
The average prize drops from 2.84 to 2.74 buy-ins.
At a 38% win rate, that lowers ROI from 7.92% to 4.12%.
So the x1000 row alone is worth 3.8 ROI points in this example.
That is why jackpots matter even if they are very rare. If you never hit one in a small sample, your graph is not "lying". It is just incomplete.
Why variance is so brutal in Spins
Spin & Go is a high variance format because the prize structure is lopsided.
You can play well and still run badly over a short sample, because the rare big multipliers have a huge effect on the result. A few normal wins or losses do not always balance a missing jackpot.
That is also why players often misread their own progress. In a short sample, the graph may mostly be telling you whether you have won a large multiplier yet, not whether you are truly better than the field.
The practical conclusion is simple:
- your long-run ROI is real,
- your short-run ROI is mostly noise.
Both can be true at the same time.
How many Spins before results say something?
Now for the question everyone asks: how many Spins do you need before your results mean anything?
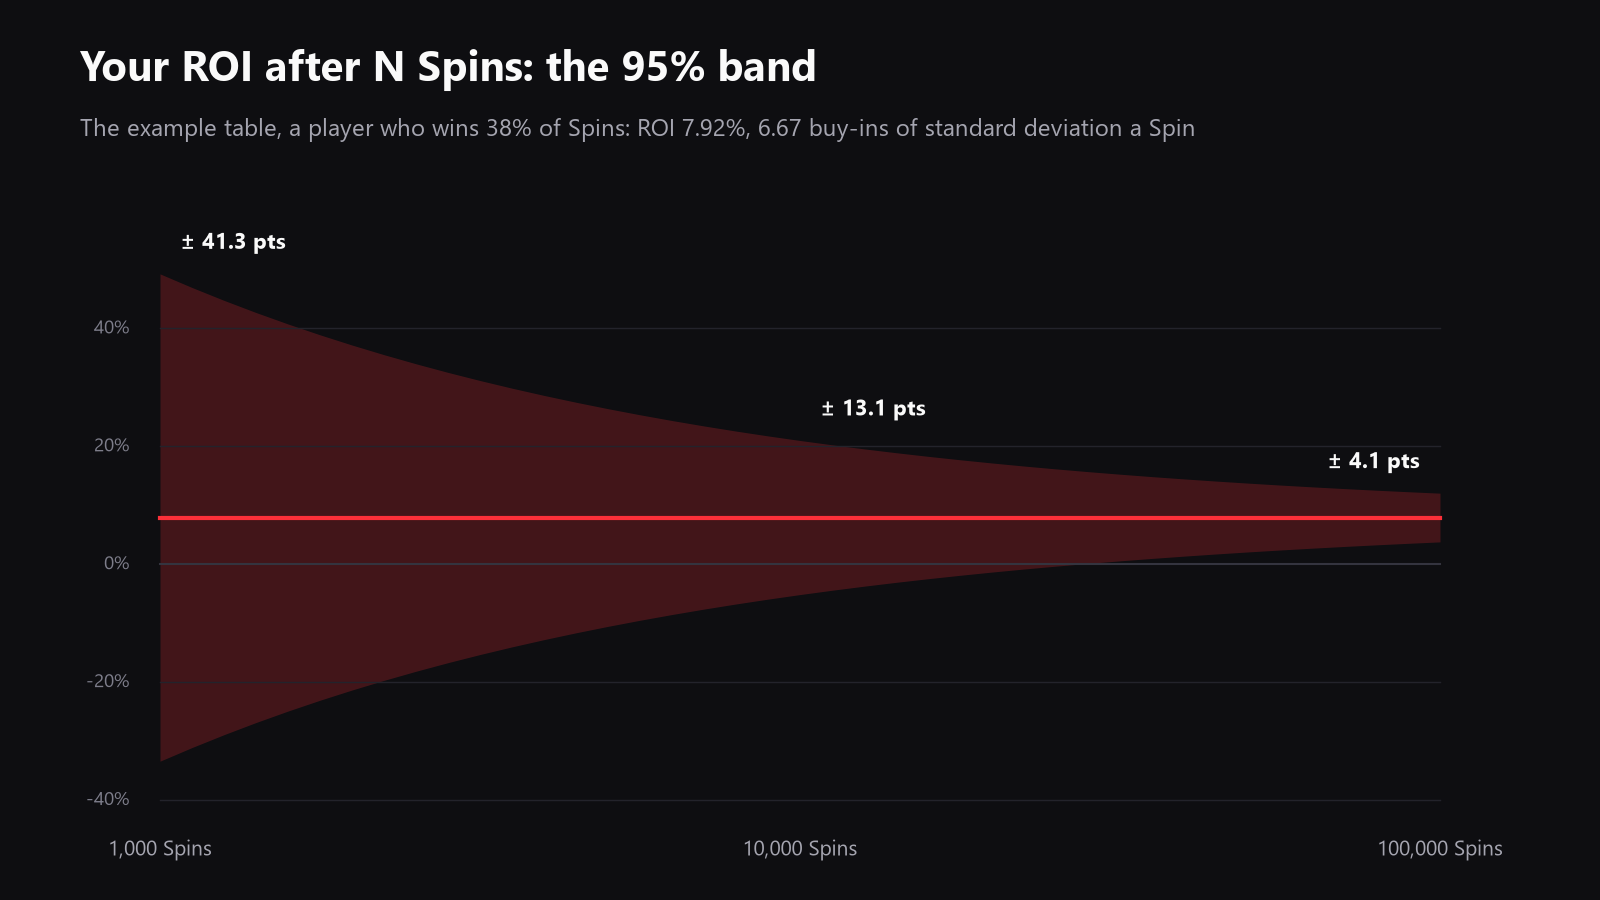
In this example, with a 38% win rate, one Spin has a standard deviation of 6.67 buy-ins.
That sounds large because it is large.
For the average result over n Spins, the standard error shrinks like 1 / square root of n. The 95% interval around ROI is therefore still wide at first:
- after 1,000 Spins: plus or minus 41.3 points
- after 10,000 Spins: plus or minus 13.1 points
- after 100,000 Spins: plus or minus 4.1 points
So even after 1,000 Spins, the sample can be wildly off. A real winner can still look like a loser, and a loser can still look like a winner.
You also get a useful jackpot reality check from the same example:
- the x1000 is drawn at least once in 9.5% of 1,000 Spin samples,
- 63.2% of 10,000 Spin samples,
- 95.0% of 30,000 Spin samples.
If you win 38% of your Spins, you win the x1000 only about 38% of the times it is drawn, so the chance of at least one x1000 won in 10,000 Spins is about 31.6%.
In other words, at 1,000 Spins, most samples still will not have won the biggest jackpot at all. At 10,000, it is still less likely than not. At 30,000, you should almost expect to have won one.
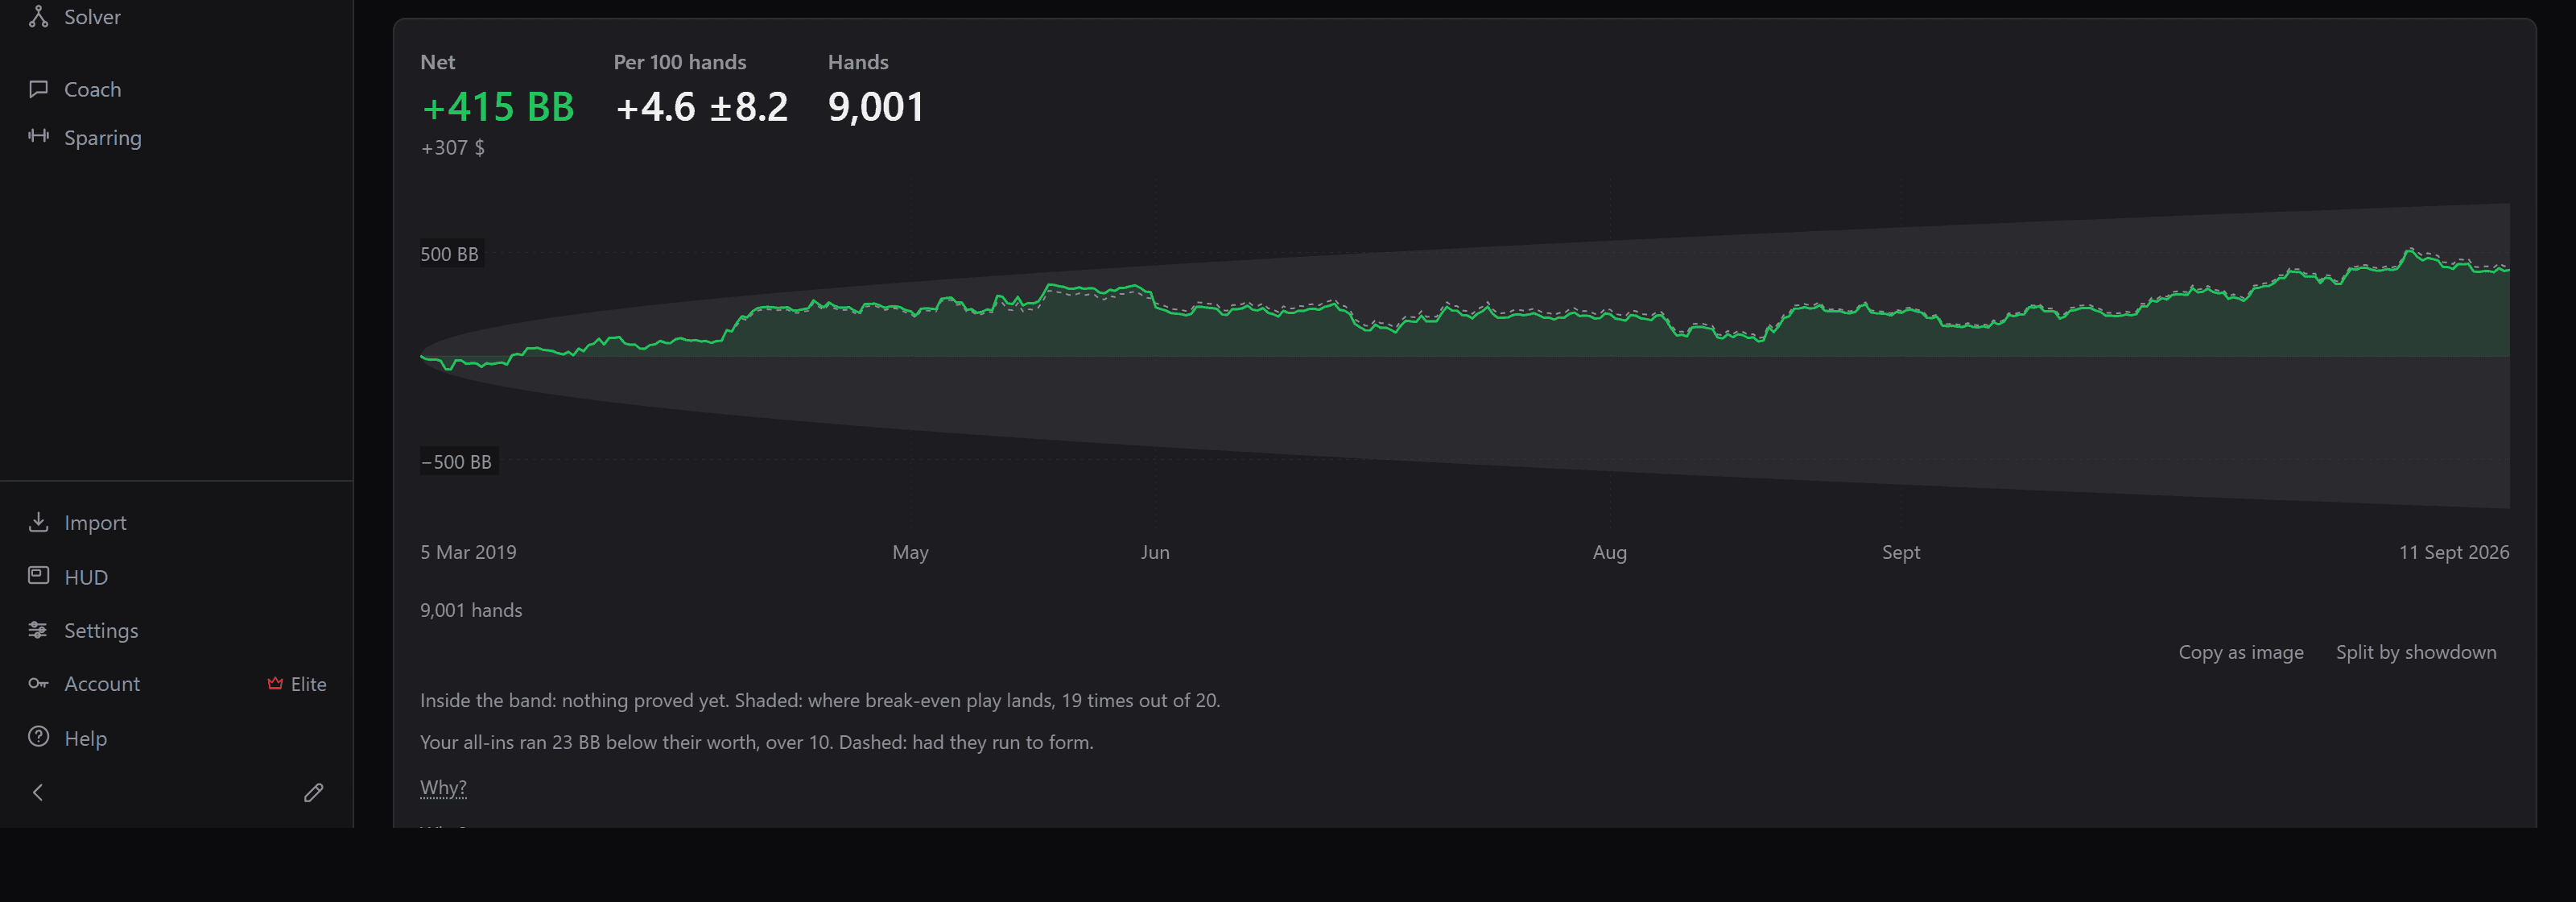
What to do with this in practice
If you play Spins, do not judge your game only by a small result sample.
First understand the table. Then understand your win rate. Then ask whether the sample is large enough to say something useful.
That is the right order.
If you track your own hands, the Results module gives ROI and ITM, filtered by format (Spin & Go), with the rake beside the result; it does not split a swing between the multipliers drawn and the player's play. And if you want to study the short-stack decisions that matter in Spins, the Decisions module can work out push, fold or call spots off the table, with push/fold charts.
But the main lesson is bigger than any one tool:
Spin & Go variance is not a bug. It is the format.
The multiplier table carries the rake, the jackpots carry a real part of the expected value, and the rare top end carries a lot of the swing. If you want to know whether you are truly winning, you need enough volume for the noise to shrink and the signal to show itself.
Do it on your own hands.