
If you play Spin & Go, your results can lie to you.
That is not a bug in the format, it is the format. A single big multiplier, a cold run through a tough stretch, or a rake-heavy pool can move your graph far more than your true skill. If you want to know whether you are improving, you need to track your Spin & Go results the right way.
The three things that matter most are:
- your ROI
- the variance created by the payout structure
- the sample size you need before the numbers mean anything
A good tracking system does not just tell you if you are winning. It tells you whether the sample is large enough, whether rake is eating your edge, and whether a hot or cold streak is probably just noise.
What you should track in Spin & Go games
If you want your results to be useful, do not stop at profit.
At minimum, track:
- number of Spins
- total buy-ins paid
- net profit
- ROI
- rake paid
- stake level
- site or room
- date range
- format details, such as turbo, hyper, jackpot, or prize structure
- your own study notes on strategy changes, if you keep them separately
The biggest mistake is to track only the bankroll curve. That tells you what happened, but not enough about why it happened.
In Spin & Go, the payout structure matters so much that two players with the same skill can look very different over the same sample. One player may hit a few large prizes. Another may play well and still run badly for months.
ROI in Spin & Go, explained simply
ROI means return on investment.
The formula is:
ROI = net profit / total amount invested
If you play $10 Spin & Go games with a $0.50 fee, your investment per game is $10.50. If you play 5,000 games, your total investment is $52,500.
If your total cashes are $55,125, your net profit is $2,625.
So:
ROI = 2,625 / 52,500 = 5%
That is the number you care about when you want to know whether your Spin & Go results are actually good.
Important detail: include rake
Do not ignore the fee. In Spins, rake is not a footnote. It is part of the game.
If you track only the buy-in without rake, you will overestimate your win rate. If you want a realistic view of your results, track net ROI after rake.
That matters especially in micro and small stakes, where rake can eat a big part of your edge.
Why Spin & Go variance is so high
Spin & Go variance comes from three places.
1. Small player count
Only a few players sit in the game. That means your edge is realized over a very small number of decisions per game.
In a cash game, hundreds of hands can smooth the outcome. In a Spin & Go, one flip, one ICM spot, or one heads-up sequence can decide the whole result.
2. Payout multipliers
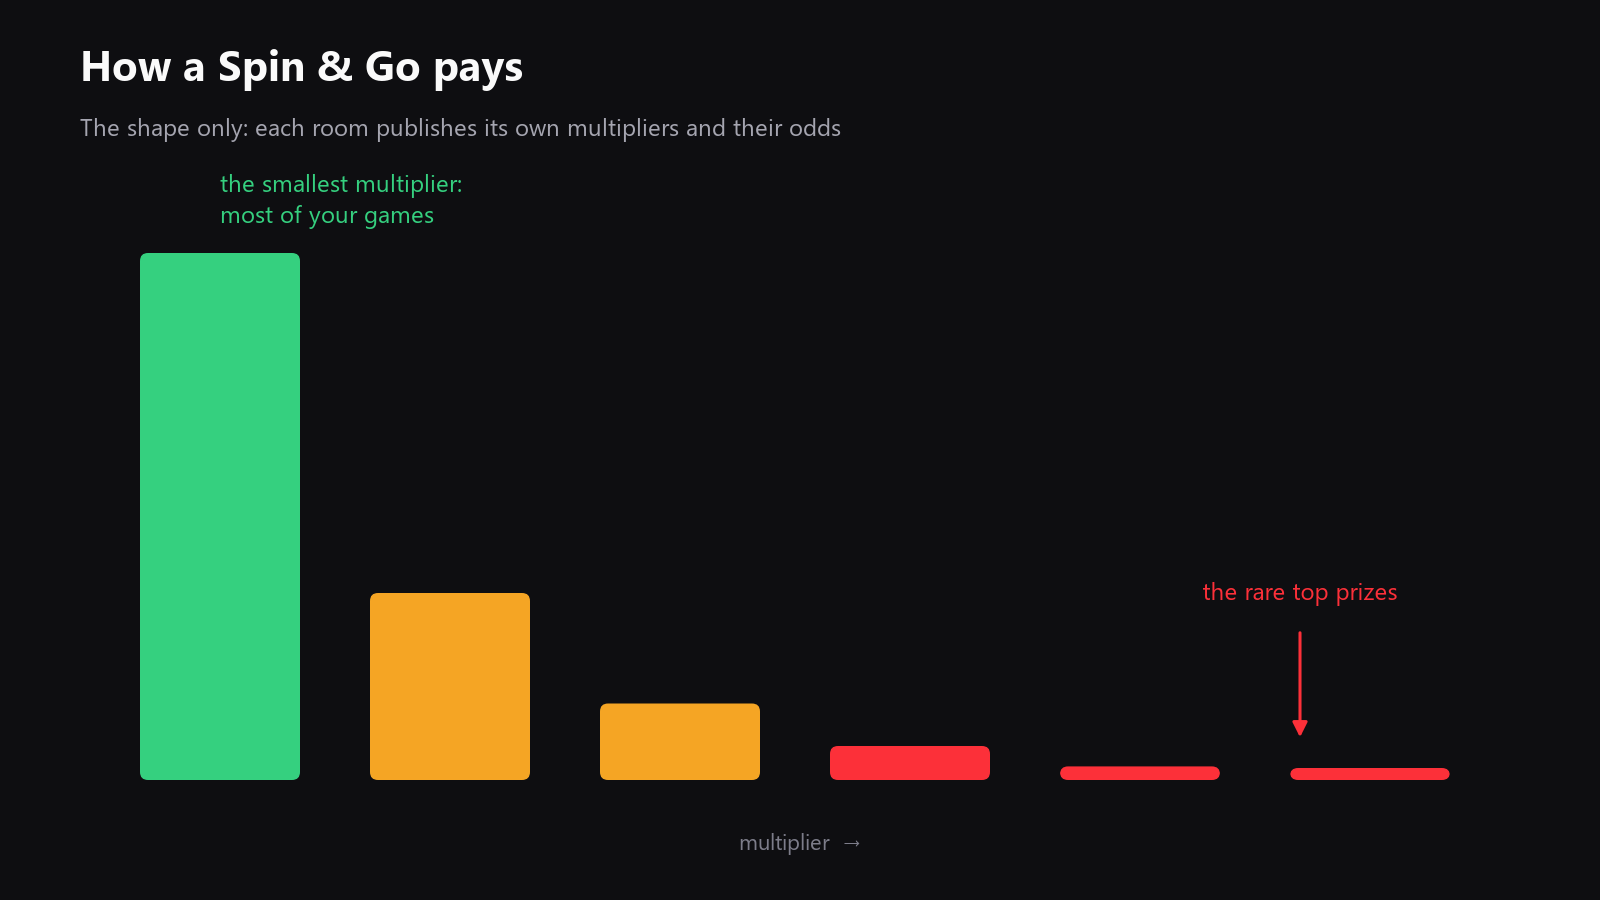
The jackpot structure creates a fat-tailed distribution.
Most games pay the smallest multiplier. A few pay more. A tiny fraction pays much more.
That means a single rare hit can contribute more to your graph than dozens or even hundreds of normal games.
3. Short stack and ICM pressure
Spin & Go strategy is not just chip EV. Prize equity changes constantly.
That makes the format strategically rich, but also much swingier than games where chips map more linearly to money.
So when you look at your results, remember this:
A short sample mostly measures variance. A long sample starts to measure skill.
The trap: confusing a lucky run with a real edge
A player can run hot for 2,000 Spins and think they solved the format.
Another player can run cold for 10,000 Spins and think they are a loser.
Both reactions are wrong.
The true question is not:
- "Am I up?"
- or "Am I down?"
The real question is:
- "Is this result bigger than the noise?"
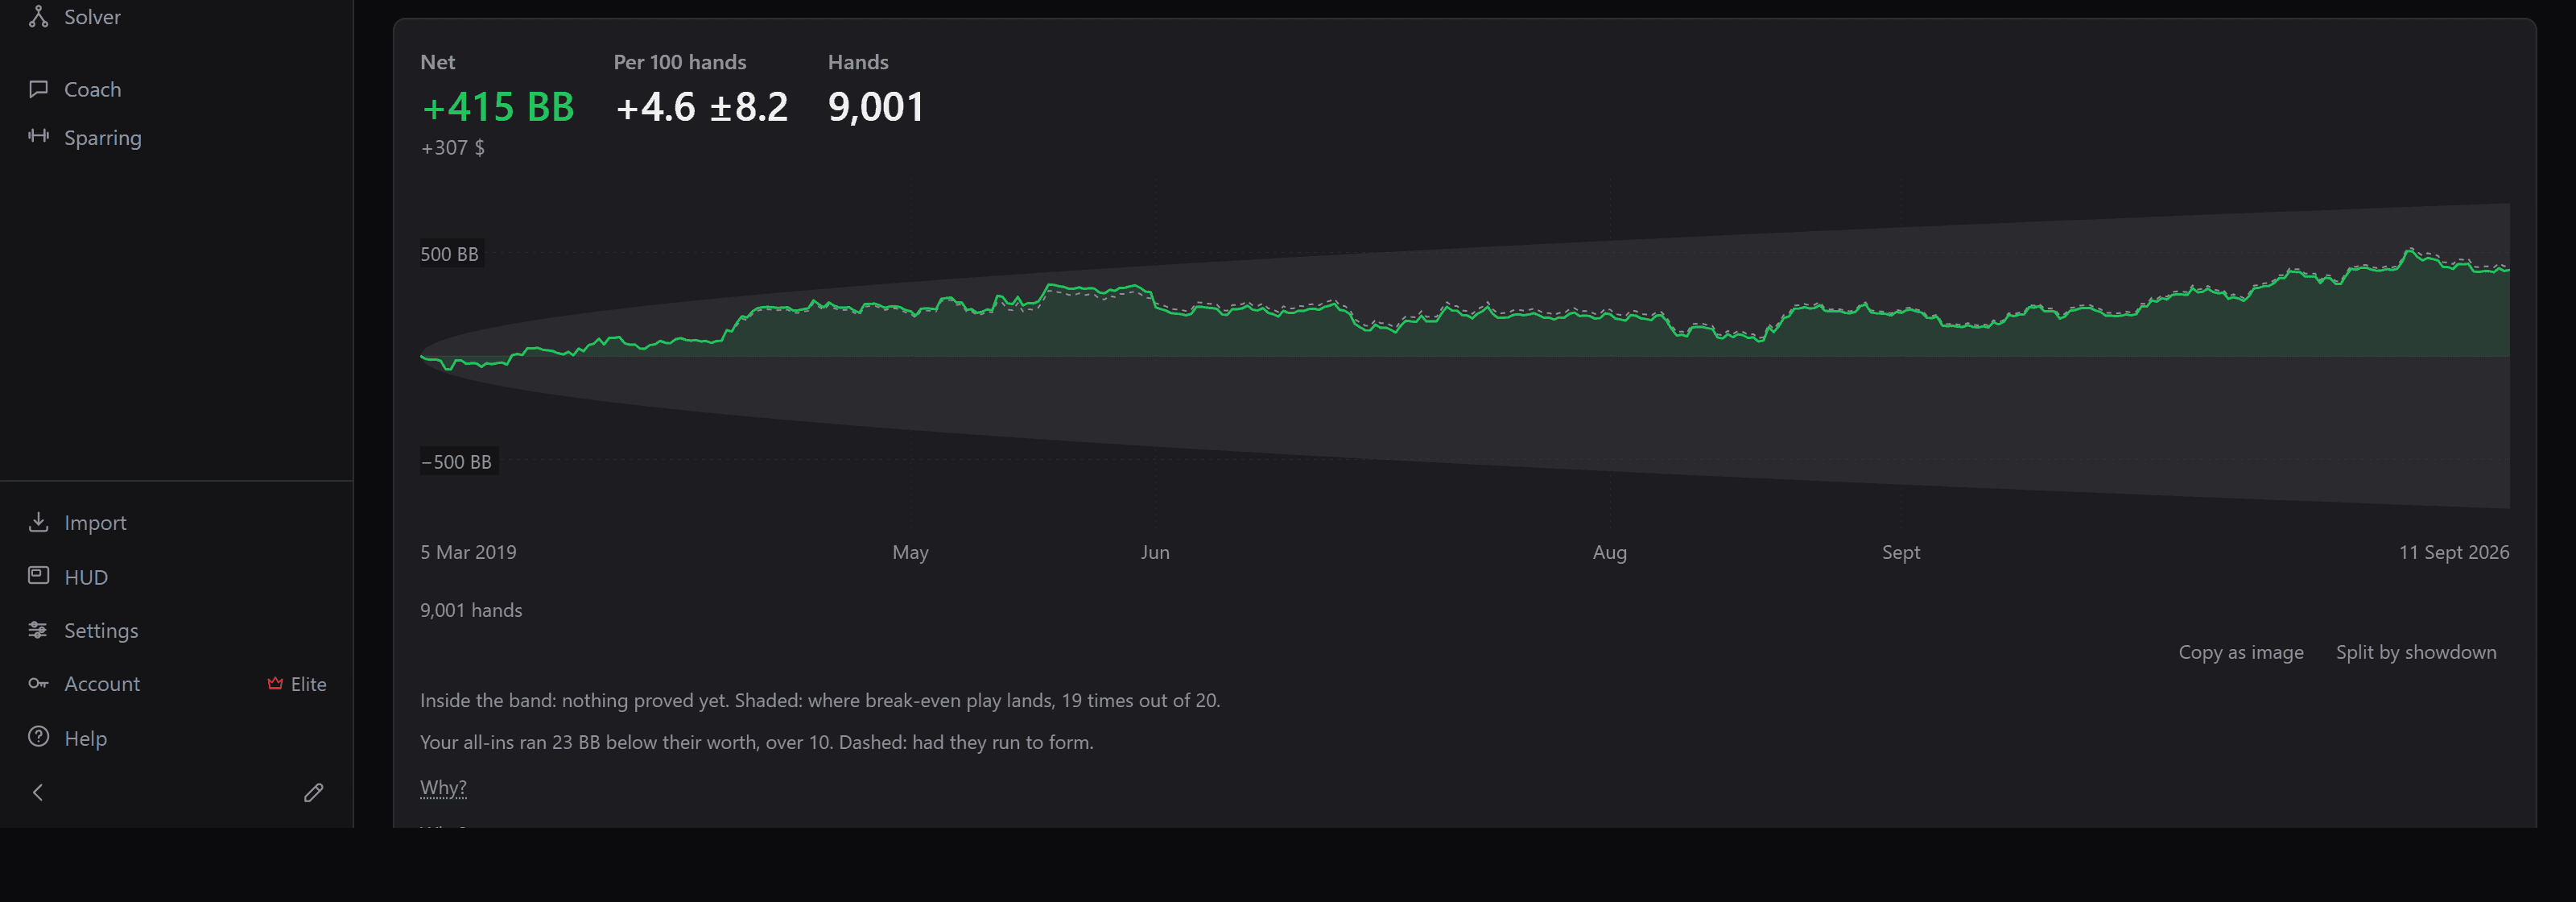
That is why a graph needs context. A line without a variance band is just decoration.
If you can, always look at your results next to:
- the number of games
- the rake paid
- the stake
- and a variance band
That is the honest way to read Spin & Go results.
How many Spins do you need before your results mean something?
There is no single magic number, because the answer depends on:
- your true edge
- the rake
- the payout structure
- how volatile the pool is
- whether you are mixing stakes or formats
But you still need a practical answer, so here is a good rule of thumb.
Rough guide by sample size
| Sample size | What it can tell you |
|---|---|
| 1,000 Spins | Almost nothing reliable. Good only for spotting huge leaks or extreme runs. |
| 5,000 Spins | Still very noisy, but enough to begin seeing if something is badly off. |
| 10,000 Spins | Directionally useful. You can start to trust broad trends. |
| 20,000 Spins | Much better. You can often tell whether your ROI is likely positive, breakeven, or negative. |
| 50,000 Spins+ | Stronger evidence. Better for comparing stakes, rooms, or strategy changes. |
That table is not a law. It is a practical guide.
If your edge is small, you need more games. If your sample is mixed across different stakes or rooms, you need more games. If the rake is high, you need more games.
A simple statistical idea
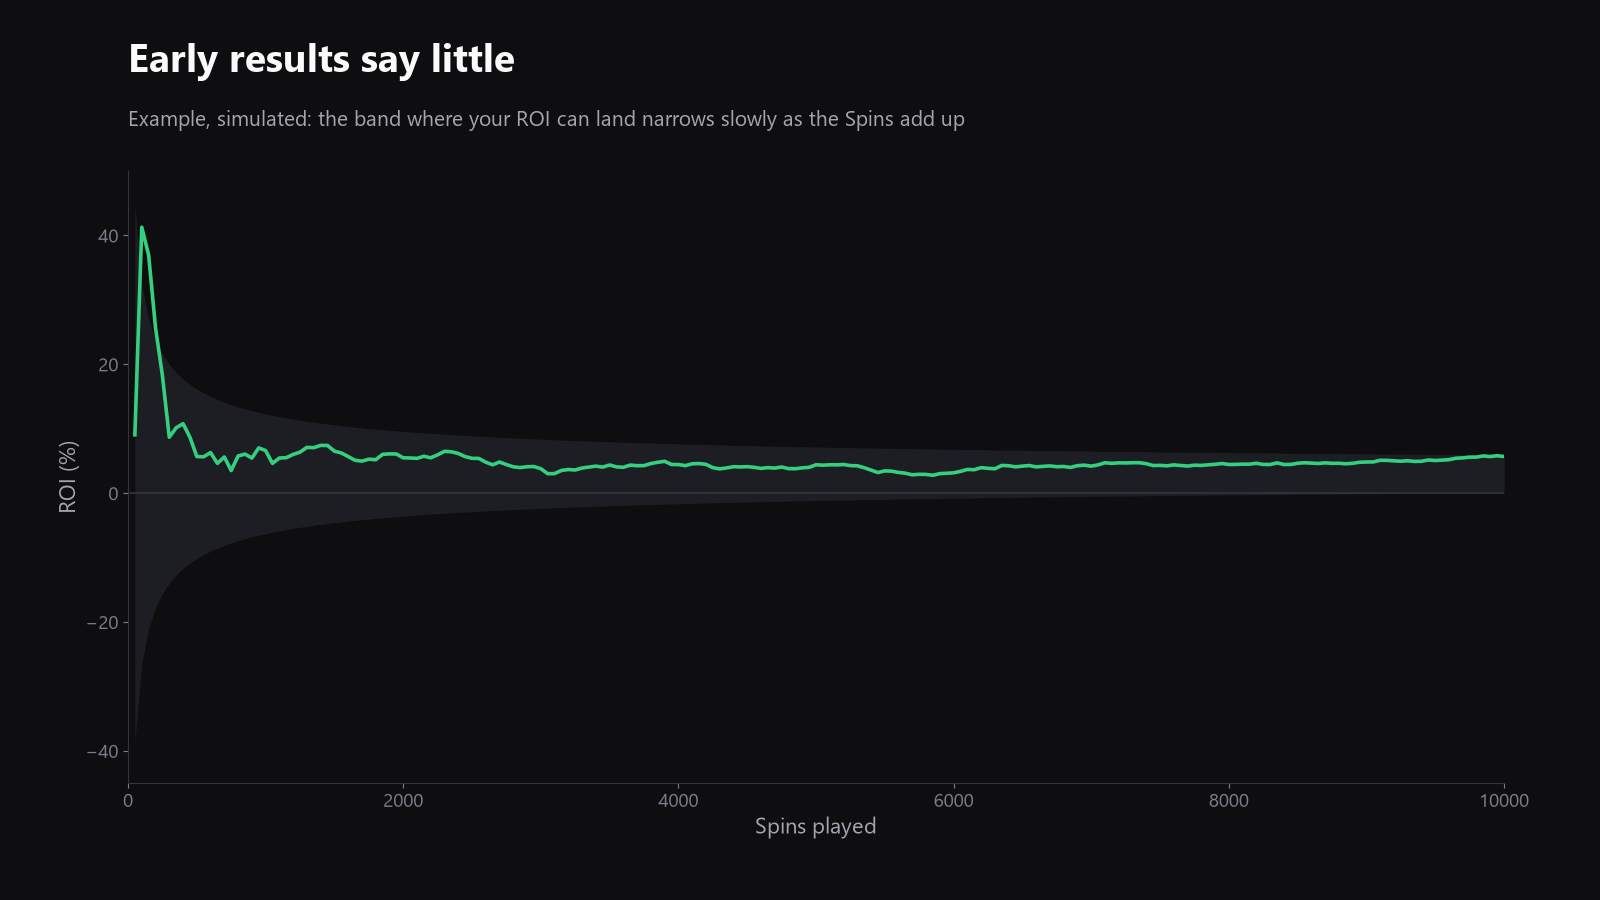
Your uncertainty shrinks as the square root of your sample size.
That means doubling your volume does not cut uncertainty in half. It helps, but slowly.
This is why 1,000 Spins can lie to you, and 10,000 Spins can still be too small. Spin & Go variance is not polite.
What to look at besides total ROI
If you only track total ROI, you miss important information.
1. ROI by stake
A player can be winning at one stake and losing at another.
That happens because:
- rake changes
- player pools change
- your own strategy may not scale cleanly
- ICM skill matters more in tougher pools
So split your results by stake.
2. ROI by site
Different rooms are not the same game.
The rake structure, field quality, and prize ladder can change a lot from one room to another.
If you mix rooms, you can easily hide the truth.
3. ROI by time period
Your results in the last month matter more than your lifetime graph if you are actively improving.
But do not overreact to one month. Use time periods to detect real changes, not to chase noise.
4. Prize structure and top hits
The prize structure itself changes how your graph behaves.
A few large payouts can carry a lot of your profit. Missing the top end for a while can make solid play look much worse than it is.
The point is not to obsess over luck. The point is to understand how much of your graph is driven by the structure of the game.
5. Rake paid
This deserves its own line again.
In Spin & Go, rake can be the difference between a small winner and a small loser.
A player who does not track rake is flying blind.
A good way to review your Spin & Go results
Here is a simple process you can use every week.
Step 1: Record every session
At the end of a session, update:
- number of games
- net profit
- buy-ins invested
- rake paid
- site and stake
Step 2: Keep separate buckets
Do not throw everything into one pile.
Use separate samples for:
- each stake
- each site
- each format
- each major strategy change
If you move from one room to another, start a fresh comparison.
Step 3: Look at a graph, not just a total
The total profit can hide a lot.
A graph shows:
- whether you are trending up or down
- how rough the swings are
- whether one runout or one prize hit is dominating the sample
Step 4: Compare results to the variance band
This is the key step.
If your graph is inside the noise, do not over-interpret it.
If your graph stays outside the expected range over a large sample, now you have something worth studying.
Step 5: Adjust only when the evidence is strong
Do not change your whole strategy because of a bad week.
If you want to improve, look for measurable leaks:
- too loose in ICM spots
- poor push fold decisions
- bad heads-up endgames
- overcalling in spots where the pool is underbluffing
- leaking equity in high-pressure prize spots
That is how you turn results into work.
What a good Spin & Go tracker should show you
A good tracker should make this easy.
At minimum, it should let you see:
- profit and ROI
- rake paid
- results by stake
- results by site
- results by month
- a variance band or equivalent visual range
- a long-term graph and recent sample side by side
For example, the Results module in Poker Exploit keeps the rake next to the result and lets you break down your graph by month, room, and stake. That makes it much easier to see whether your sample is actually saying something.
You do not need a fancy tool to understand the logic, but a good tool saves a lot of manual work.
Common mistakes when tracking Spin & Go results
Mixing stakes
A $1 sample and a $10 sample should not be treated as one game.
Ignoring rake
This makes weak results look better than they are.
Judging yourself too early
1,000 games is a blink in Spin & Go terms.
Chasing the biggest winner or loser
One huge multiplier can distort your thinking.
Using only profit, not ROI
Profit tells you how much money you made. ROI tells you how well you used your bankroll.
Changing strategy after a tiny sample
If you adjust too fast, you may end up reacting to noise instead of data.
Is chip EV enough in Spin & Go?
Not by itself.
Chip EV can help in study, especially for all-in decisions. It can be useful to know if your pushes and calls are sound.
But in Spin & Go, money equity is what ultimately matters. The payout structure and ICM mean that chips are not the same as cash.
So use chip EV as a study tool, not as your only performance metric.
What a "good ROI" means
There is no universal good ROI.
It depends on:
- stake
- rake
- field strength
- site structure
- your sample size
- whether you are looking at pre-rake or post-rake numbers
A small positive ROI can be real. A bigger ROI can still be temporary. A negative ROI can come from variance, rake, or real leaks.
That is why you should never use one month, or one lucky stretch, as proof.
A practical bottom line
If you play Spin & Go, track more than your bankroll.
Track:
- ROI
- rake
- stake
- site
- sample size
- variance in the result
Then read the graph the right way.
- Small samples are mostly noise.
- Medium samples begin to show a pattern.
- Large samples start to tell you the truth.
If you want to know where you stand, the answer is not a single session and not a single hot run. It is a disciplined record over enough games.
And if you want that record to be easy to read, use a tracker that shows the variance around your results, not just the results themselves.
Quick checklist for your next review
Before you decide anything about your Spin & Go game, ask:
- How many Spins is this based on?
- Did I include rake?
- Am I mixing stakes or rooms?
- Did I hit unusually high or low payouts?
- Is the graph outside the normal variance range?
- Am I looking at skill, or just at a run?
If you can answer those questions honestly, you are already ahead of most players tracking Spins.
Do it on your own hands.