
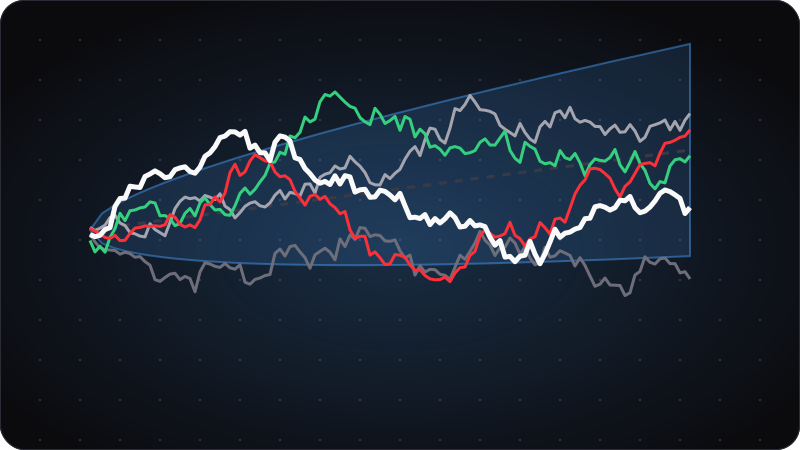
If you play enough poker, you will have stretches where everything feels wrong. You run below expectation, you lose all-ins, and a graph that should point up goes the other way for weeks. That does not automatically mean you are playing badly.
The reason is variance.
Poker is a game of small samples and noisy outcomes. Even if your decisions are good, the cards, the runout, the number of all-ins, and the way prizes are paid can push your results far away from your true win rate. If you want to understand your own results, you need two ideas first: variance and standard deviation.
Variance and standard deviation are not the same thing
People often use the word variance to mean "swings" or "how noisy the results are". Mathematically, variance is more specific.
- Variance is the average squared distance from the mean.
- Standard deviation is the square root of variance.
That second one matters more in poker, because standard deviation is in the same unit as your win rate. If your win rate is measured in big blinds per 100 hands, your standard deviation is too. Variance would be in squared units, which is why it is less intuitive to read.
So when poker players say "variance is huge", they usually mean "the standard deviation is large and the result distribution is wide."
A simple way to think about it:
- Your win rate tells you what you expect on average.
- Your standard deviation tells you how wide the outcomes spread around that average.
- Your variance band is the range of results that is still normal given that spread.
Why poker results swing so far from the win rate
Poker results do not line up neatly with skill because every hand is only one draw from a very noisy process.
A few reasons the swings are so large:
- You do not get paid every hand. Most hands end preflop or on a flop, and the size of the pot varies a lot.
- All-ins create large jumps. One stack-off can move a huge number of big blinds at once.
- Your edge is often small. A strong player might win 3, 5, or 8 bb/100. That is tiny compared with the natural spread of the game.
- The format changes the noise. Cash games, spin and gos, and MTTs do not have the same volatility.
- Tournaments add payout variance. In MTTs, most finishes pay nothing, and a small number of deep runs account for most of the money.
That last point is why tournament results can look brutal even when the poker is good. A player can make many correct decisions and still have a bad year if the final tables do not come.
The band after a given number of hands
The clean way to think about variance is to ask, "If my true win rate is this, how wide can my result be after this many hands?"
For cash games, a simple approximation is:
Expected result in big blinds = win rate x hands / 100
And the 95% spread around that expectation is:
95% band = expected result +/- 1.96 x standard deviation x sqrt(hands / 100)
If you prefer to think in win rate terms:
95% band for observed win rate = true win rate +/- 1.96 x standard deviation / sqrt(hands / 100)
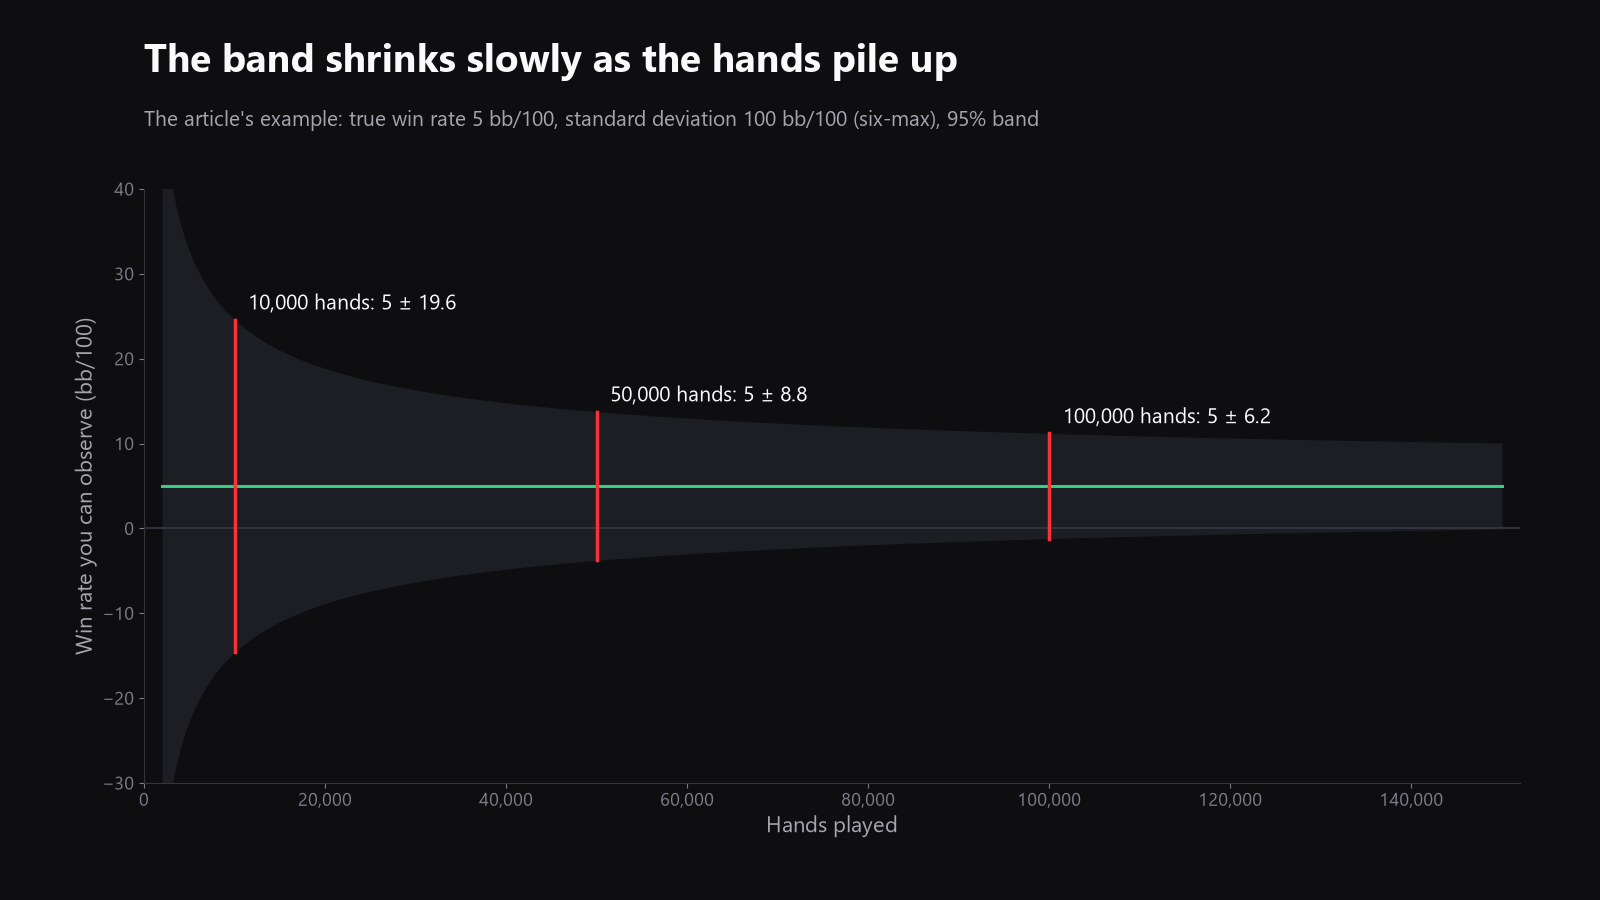
That square root is the key. More hands reduce uncertainty, but not linearly. You need a lot more hands to shrink the band by a little.
A quick cash game example
Suppose your true win rate is 5 bb/100.
If you use a typical six-max standard deviation of 100 bb/100, then:
- after 10,000 hands, expected result = +500 bb
- the 95% spread is about +/- 1,960 bb
That means a result anywhere from about -1,460 bb to +2,460 bb is still inside the normal range, even if your true win rate is +5 bb/100.
Here is the same idea at a few sample sizes:
| Hands | Expected result at 5 bb/100 | 95% band with 100 bb/100 sd |
|---|---|---|
| 10,000 | +500 bb | about +/- 1,960 bb |
| 50,000 | +2,500 bb | about +/- 4,383 bb |
| 100,000 | +5,000 bb | about +/- 6,200 bb |
That is why a winning player can still look break-even or losing over a serious sample.
If you play full ring and use a lower typical standard deviation, around 80 bb/100, the band is narrower, but it is still wide enough to fool your intuition.
How to read your own run against the band
This is where many players misread their graph.
A bad month is not automatically a bad game. A good month is not proof that your leaks are fixed. You need to compare your result with the uncertainty around it.
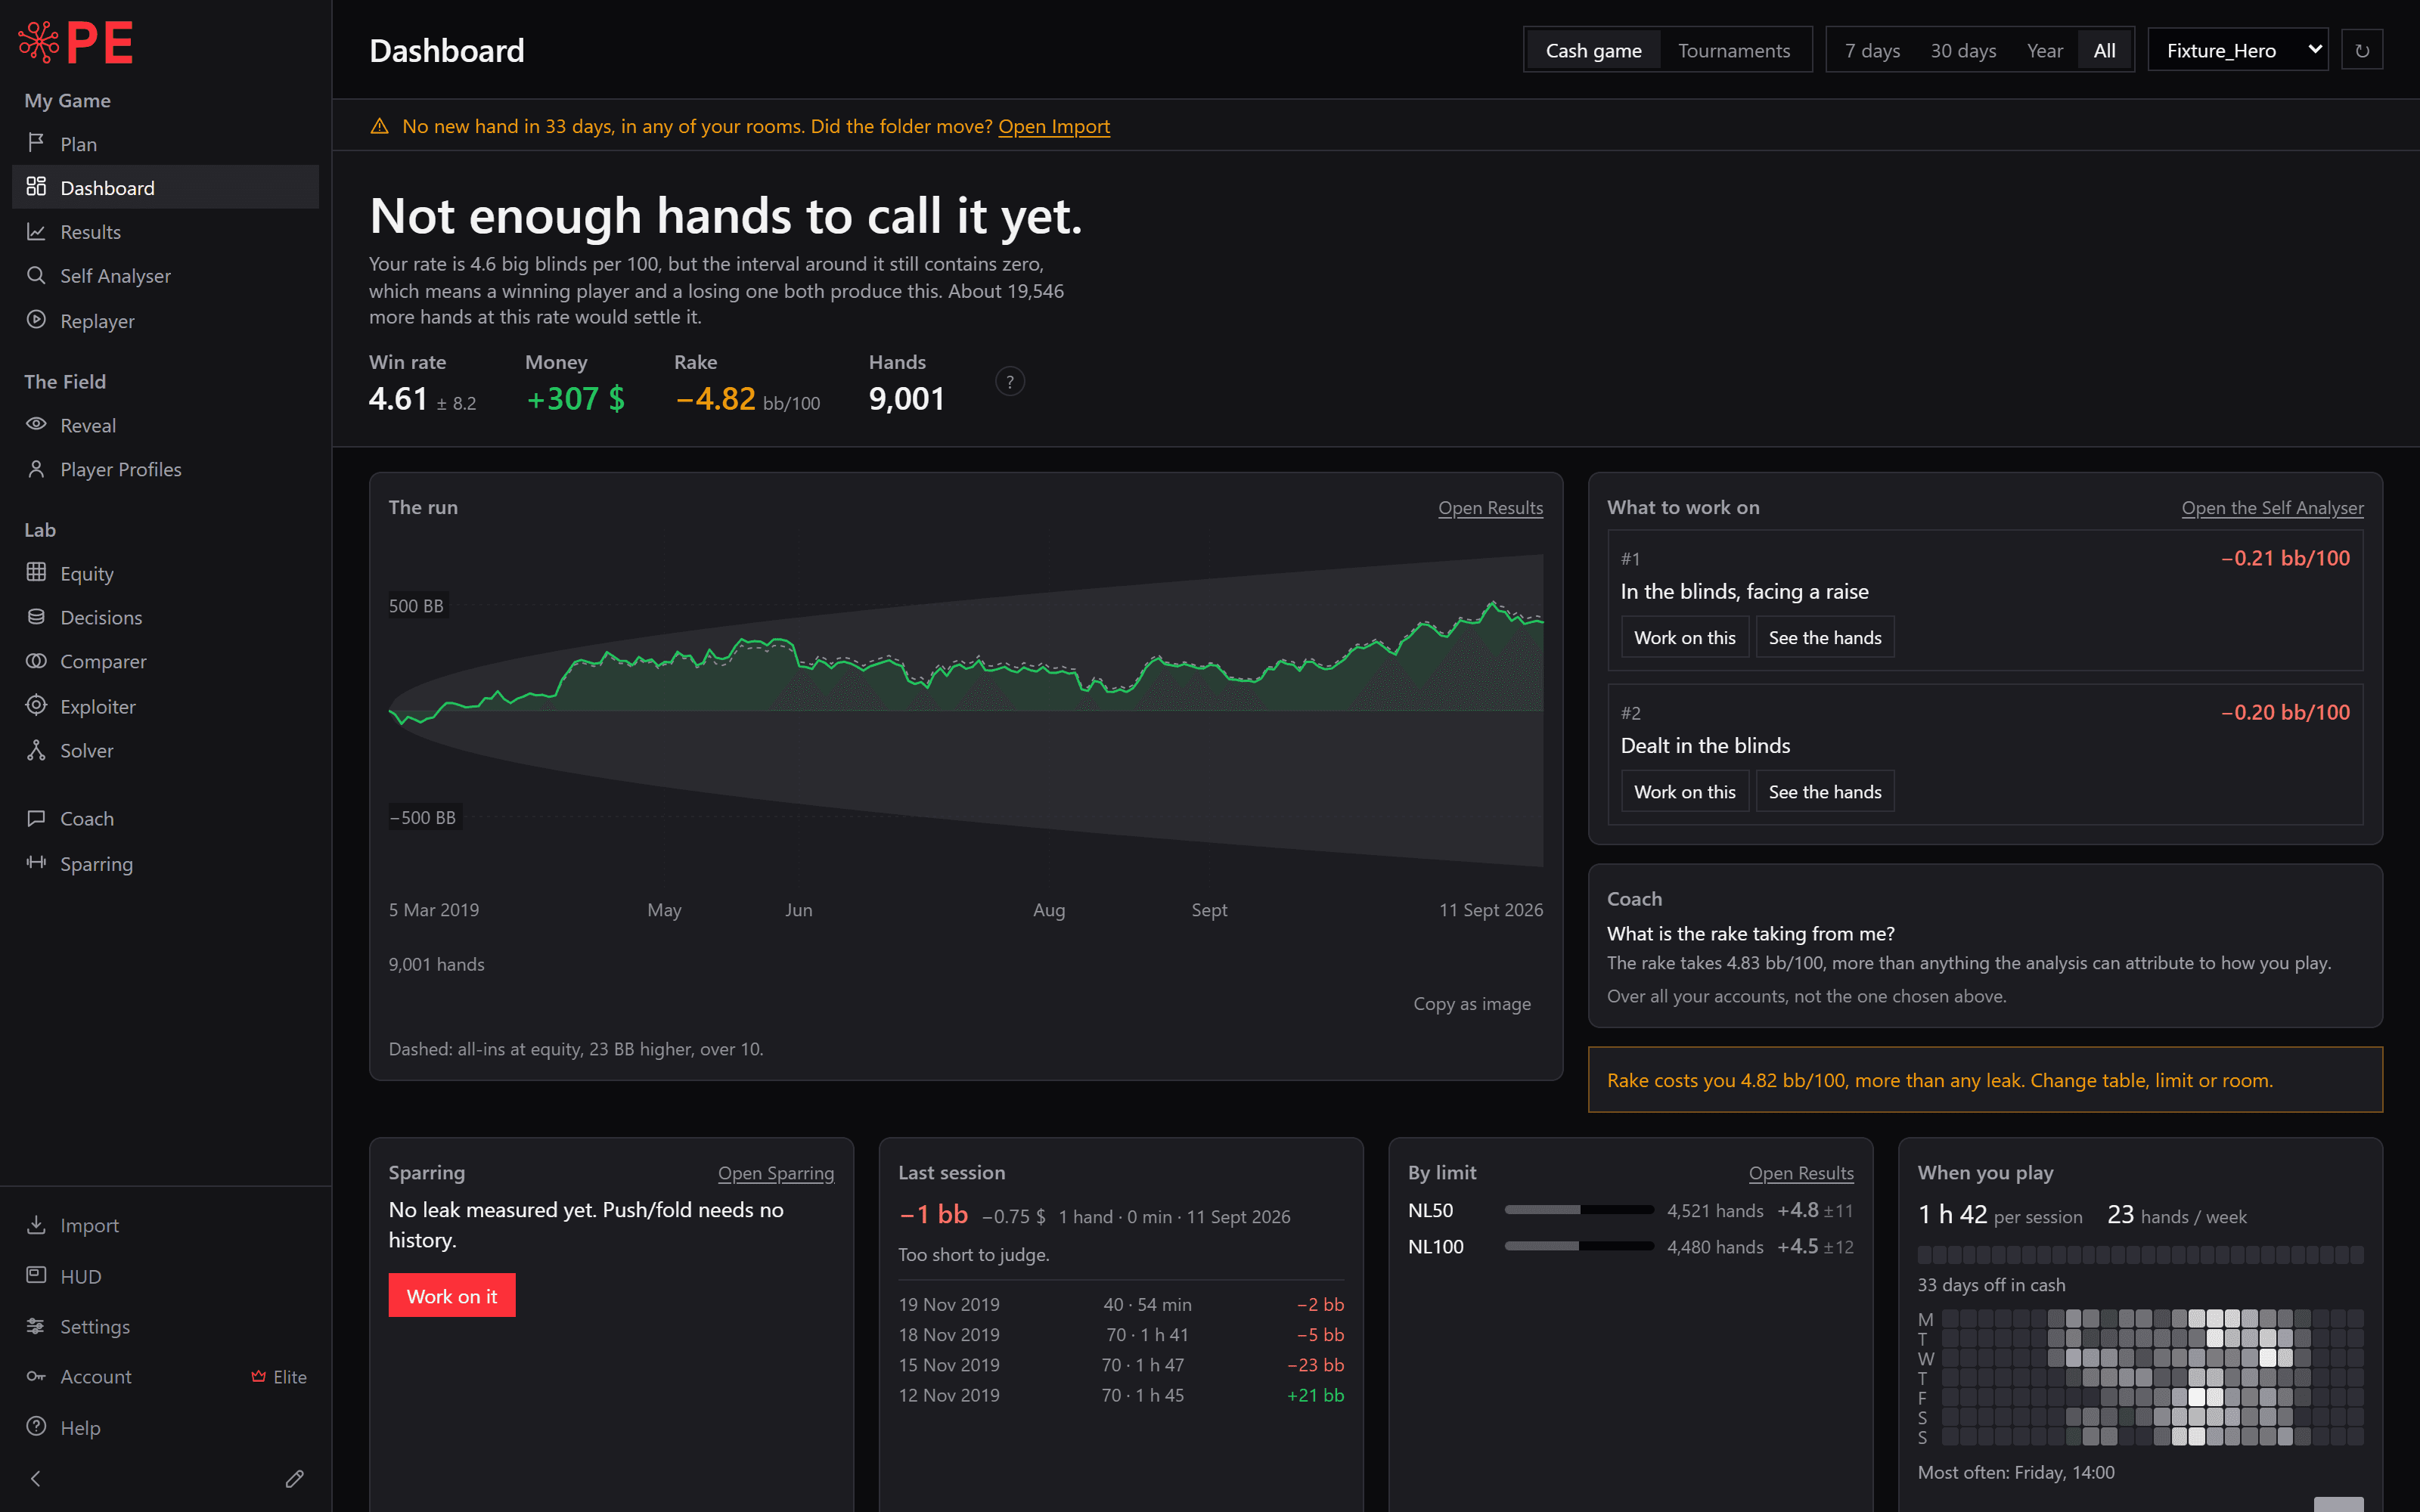
The free Dashboard module shows this directly. It gives you:
- win rate in bb/100 with its margin
- money won in big blinds
- rake paid per 100 hands
- the number of hands
- a headline saying whether the sample settles anything
- the run curve inside its cone of variance
For example, if the Dashboard shows +4.61 +/- 8.2 bb/100, that tells you something important: the estimate is positive, but the margin is still wide enough that the sample may not settle the question yet.
The practical reading is simple:
- Inside the band: your run is still compatible with normal variance.
- Outside the band, after enough hands: the sample is starting to say something real.
- If the headline says the sample does not settle it yet: do not overreact.
This is also why the rake matters. If the Dashboard says, "Rake costs you 4.82 bb/100, more than any leak. Change table, limit or room.", that is not variance. That is a structural cost that directly cuts your win rate.
What a poker variance calculator actually does
A variance calculator is not magic. It does one simple thing: it turns a win rate and a sample size into a range of likely outcomes.
For cash games, the calculator usually needs:
- your win rate in bb/100
- the number of hands
- the format, for example six-max or full ring
- an assumed or measured standard deviation
On our home page, the free variance tool uses a typical standard deviation assumption, which is stated on the page:
- 100 bb/100 for six-max
- 80 bb/100 for full ring
It then draws the 95% band and tells you how many hands that win rate needs before the band stops covering it.
That last number is useful. If your win rate is only 4 or 5 bb/100, you may need a surprisingly large sample before the result is statistically separated from zero.
Using the approximation above, a 4.6 bb/100 win rate with 100 bb/100 standard deviation needs about:
hands = 100 x (1.96 x 100 / 4.6)^2
That works out to roughly 181,500 hands before the 95% band stops covering a zero win rate.
That does not mean you need 181,500 hands to learn anything. It means you should be careful before calling a small edge "proved" at much lower volume.
What changes when the program measures your own standard deviation
The program does not have to rely on a generic assumption. It reads your own hands, so it can measure the real spread of your results.
That matters because standard deviation is not the same for everyone.
- A tight player who avoids big pots may have a lower standard deviation.
- A loose aggressive player, or a player who goes deep in pots often, may have a higher one.
- Tournament players usually have much higher volatility than cash-game players.
So the same win rate can be "stable" for one player and wildly noisy for another.
Tournaments are a different beast
Tournaments need a different explanation because the payout structure changes the whole shape of variance.
For MTTs, the calculator asks for:
- number of tournaments
- buy-in
- result
- field size
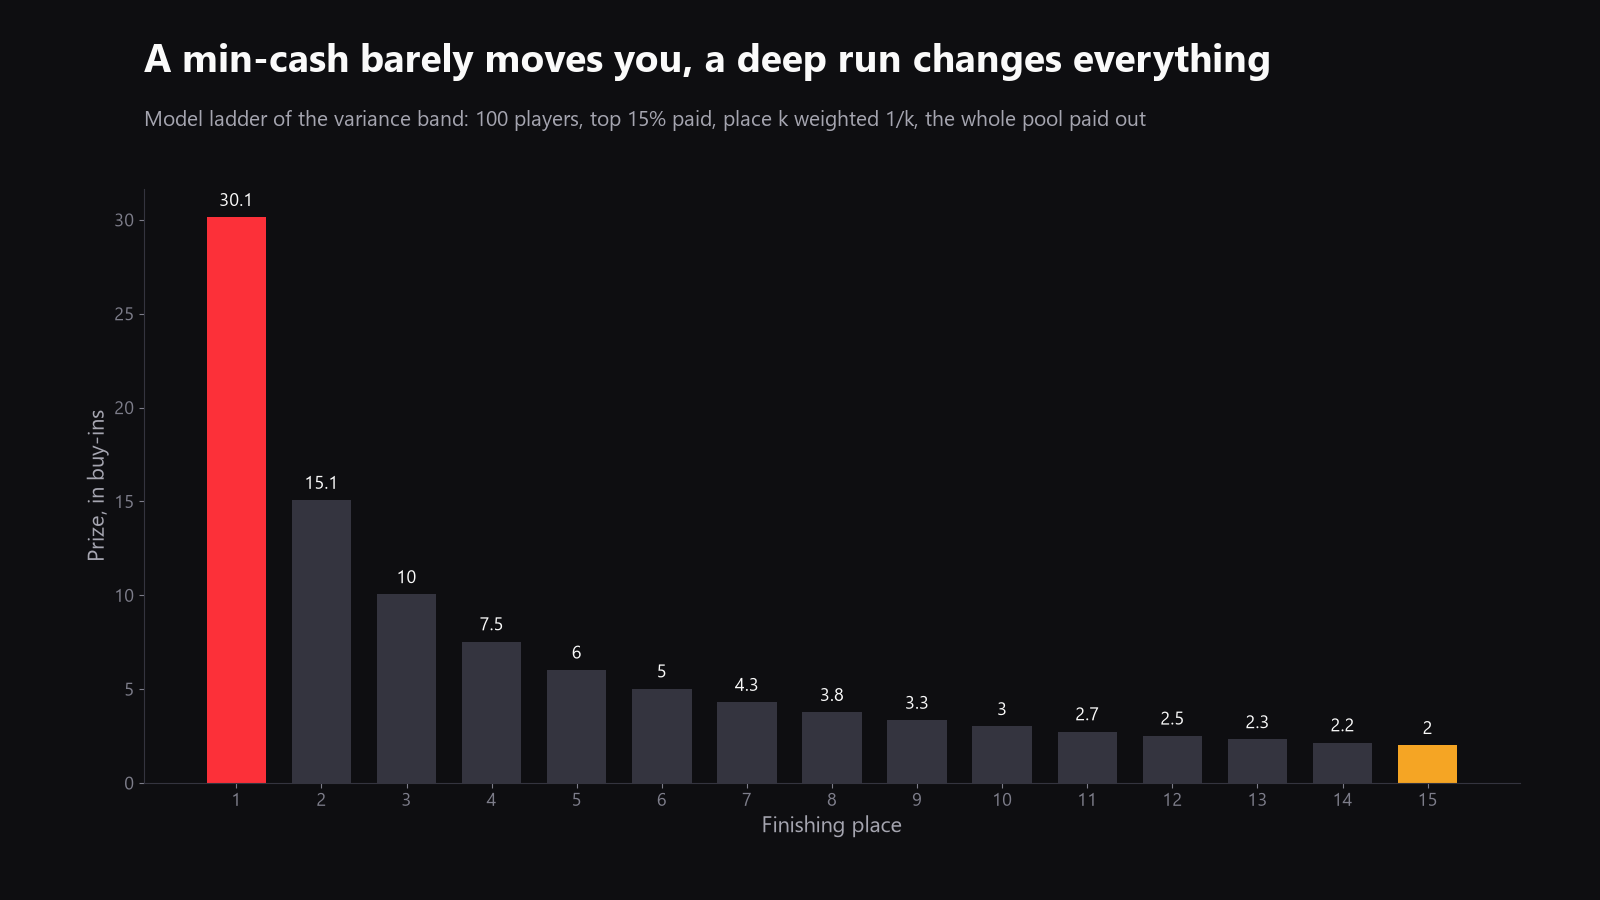
It uses a model payout ladder, with the top 15% paid.
That model matters because in tournaments the distribution is top-heavy. A min-cash barely moves the needle, while a deep run changes the result a lot.
In cash games, every hand has a fairly direct chip value. In tournaments, chip value is distorted by the prize pool, and the same stack size is worth different amounts at different stages because of ICM.
So the bands are much wider.
A useful mental model is this:
- In cash games, variance is driven mainly by pot sizes and all-ins.
- In tournaments, variance is driven by pot sizes, all-ins, survival, and payout jumps.
That is why two players with the same technical skill can have very different yearly results in MTTs.
ROI, ITM, and why tournament graphs can lie to you
If you play tournaments, two stats matter a lot:
- ROI: return on investment
- ITM: in the money percentage
They are useful, but they are not enough by themselves. You can have a decent ITM rate and still lose money if your cashes are small. You can also have a low ITM rate and still be very profitable if your deep runs are strong.
That is why the tournament part of a variance calculator should not stop at "how many times you cashed". It has to care about the payout ladder, the field size, and the size of the buy-in.
The arithmetic is different from cash games, but the lesson is the same: the observed result can sit far from the true skill level for a long time.
How to use this when you study your game
The right response to variance is not to ignore your results. It is to read them correctly.
Use this checklist:
- Compare your results with a band, not with zero.
- Ask whether the sample is large enough to mean anything.
- Separate variance from structural costs like rake.
- Check whether your all-in EV line tells a different story from the raw result.
- Look at the spots that cost you the most, not just the overall graph.
The free Results module helps with that. It shows:
- the curve and the money by month and over your career
- results by room, stake, position, and hour of day
- the rake next to the result
- the all-in EV line
- for tournaments, ROI and ITM
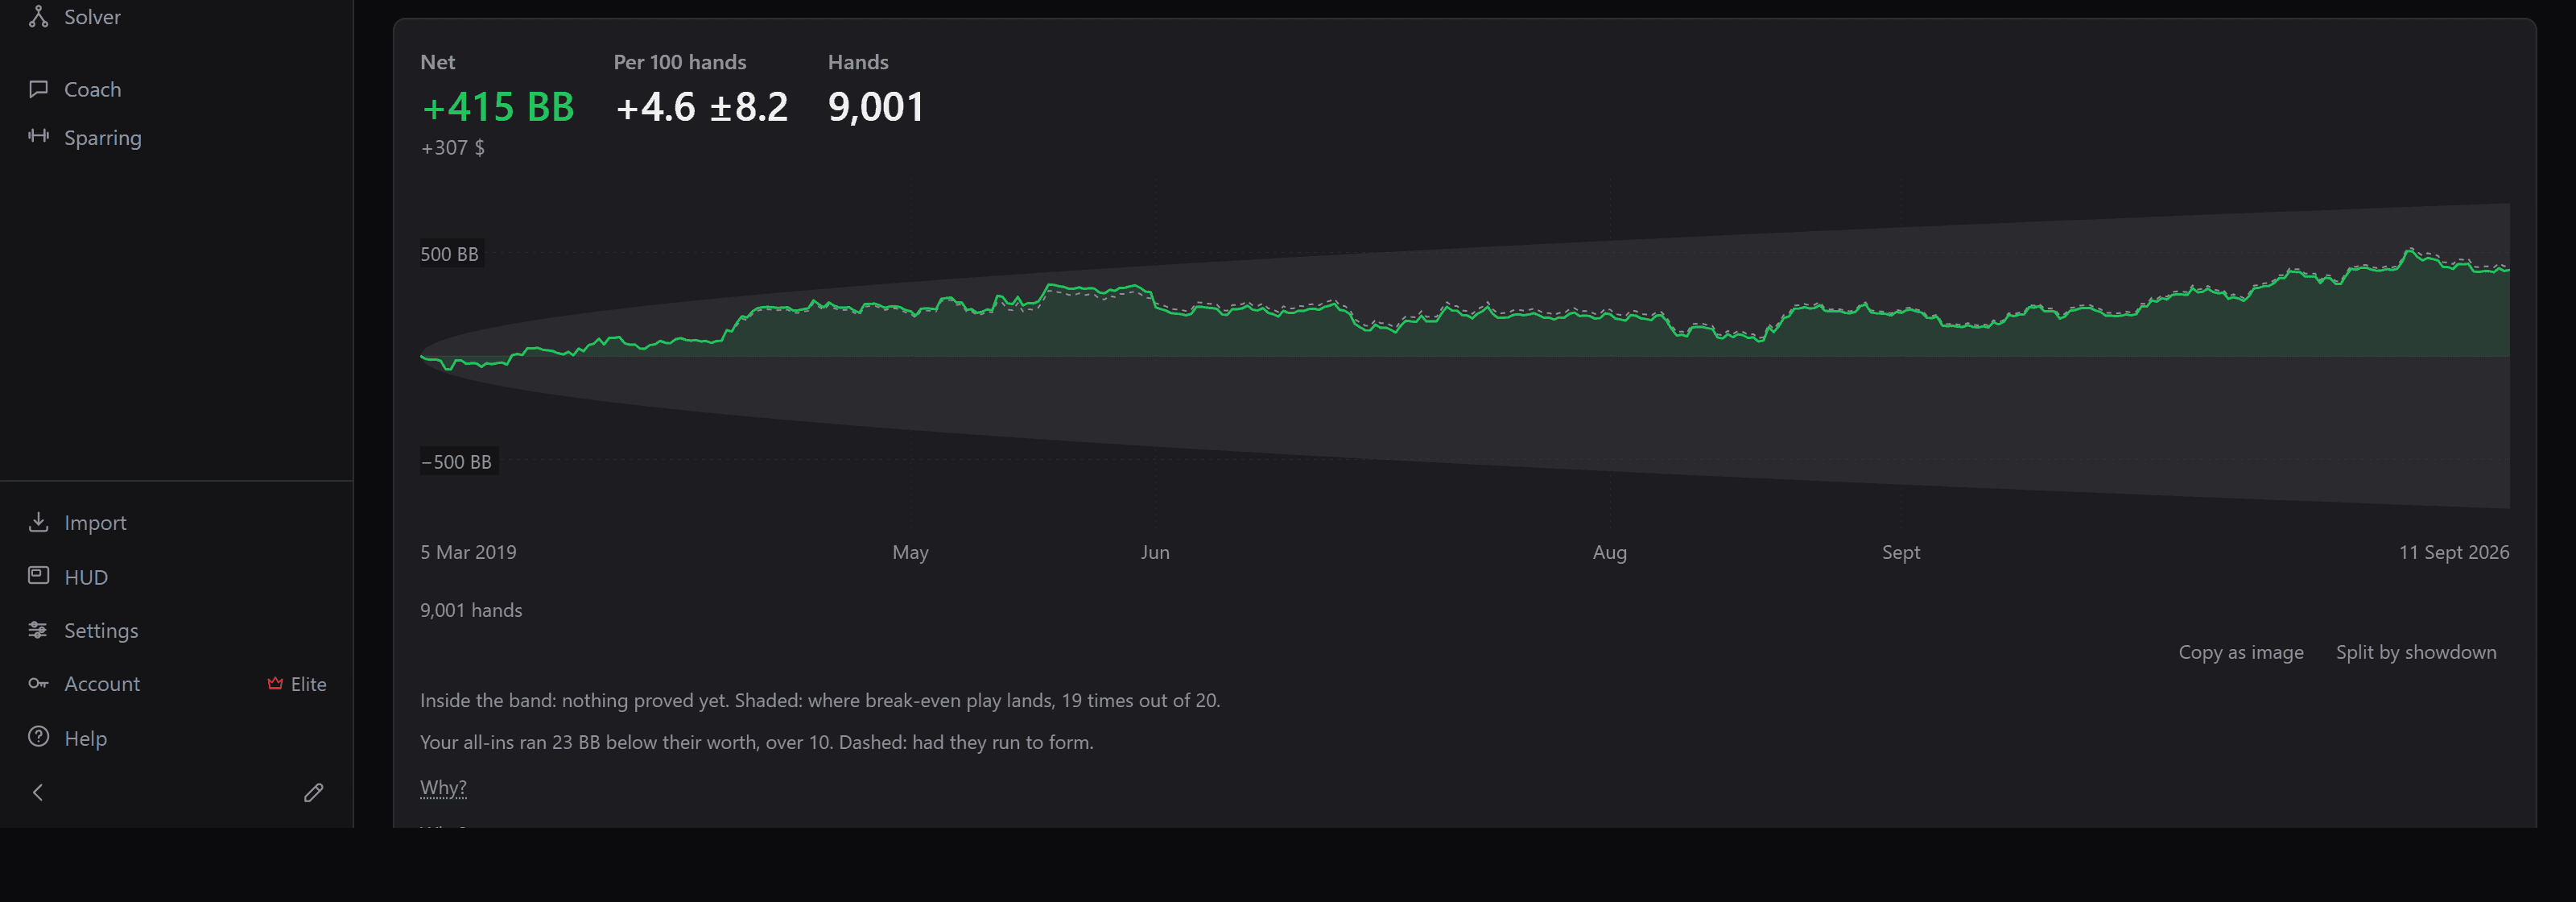
That combination is useful because it keeps you from blaming everything on luck. Sometimes the run is bad. Sometimes the rake is the real problem. Sometimes both are true.
The main takeaway
Variance is not a side topic in poker. It is part of the game itself.
If you remember only one thing, make it this: your win rate is the average, not the immediate truth of your graph. The standard deviation tells you how far the graph can wander before you should worry.
Once you learn to read the band around your results, you stop overreacting to every downswing and you start asking better questions.
And if you want the arithmetic done for a cash-game win rate and hand count, the free variance section of the home page can do that with an assumed standard deviation. In the program, the Dashboard draws your run inside its cone of variance from your own hands, and Results shows the curve, the rake next to the result and the all-in EV line.
Do it on your own hands.