
Preflop charts are one of the fastest ways to make your poker study concrete.
They tell you, hand by hand, what a solver or a model says about a spot: open, fold, call, 3-bet, sometimes mix. If you can read a chart well, you stop guessing. You start seeing structure.
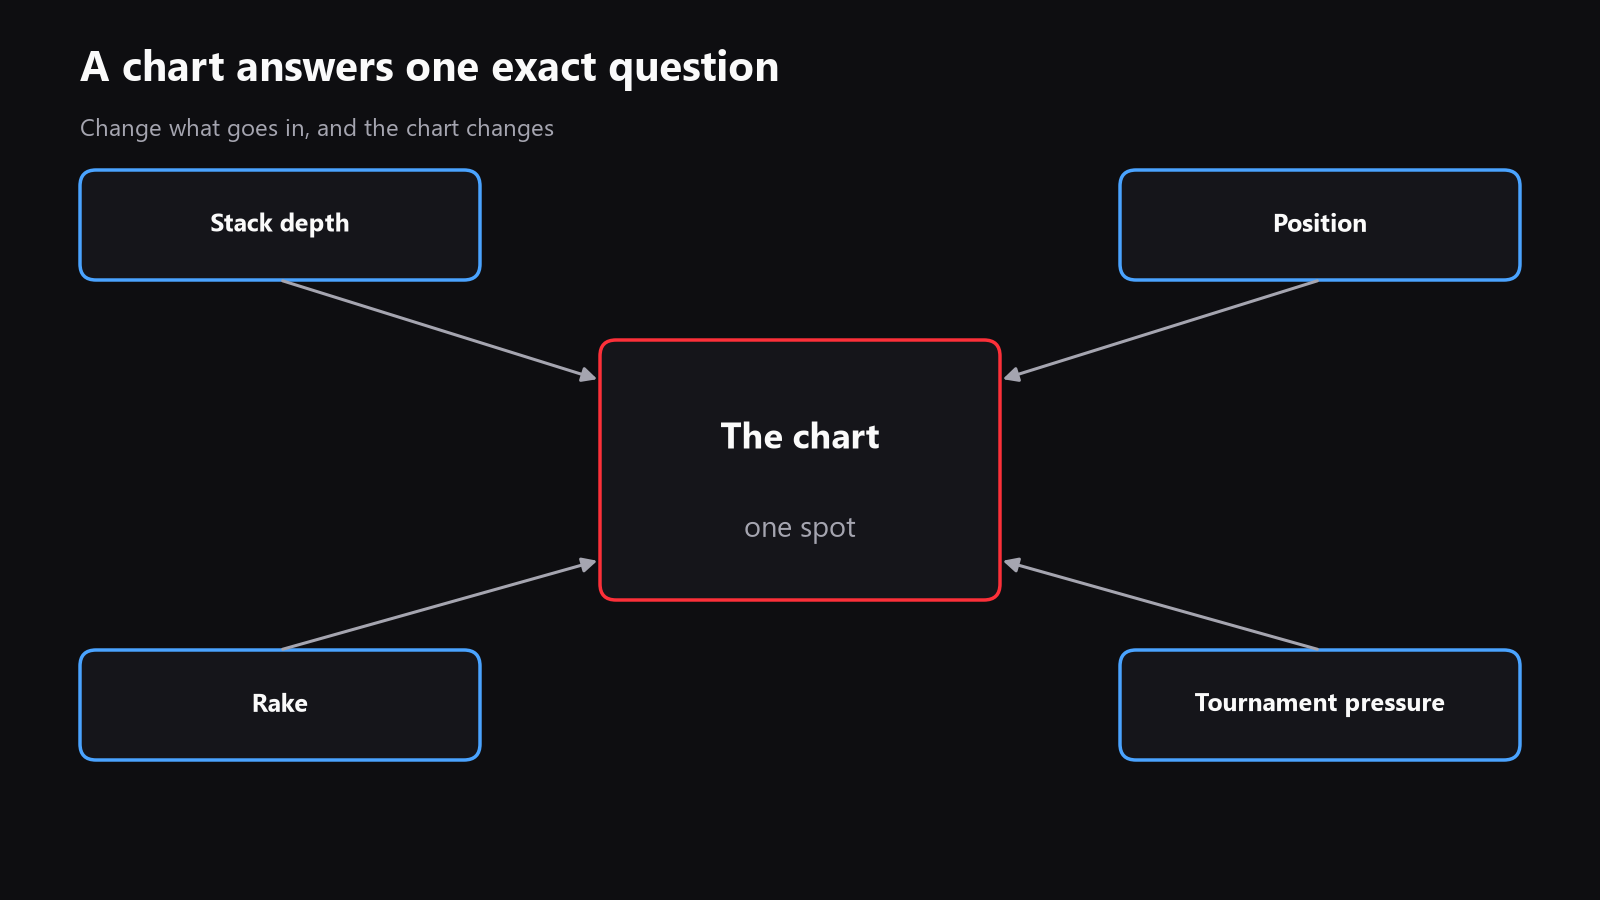
But a chart is not a commandment. It is the answer to a question under specific assumptions: stack depth, position, rake, ante structure, tournament pressure, and the behavior the model expects from the other players. If those assumptions change, the chart changes too.
That is why the best way to use preflop charts is in two steps:
- Learn from them.
- Detach from them when the table in front of you is not the table they were built for.
What a preflop chart actually is
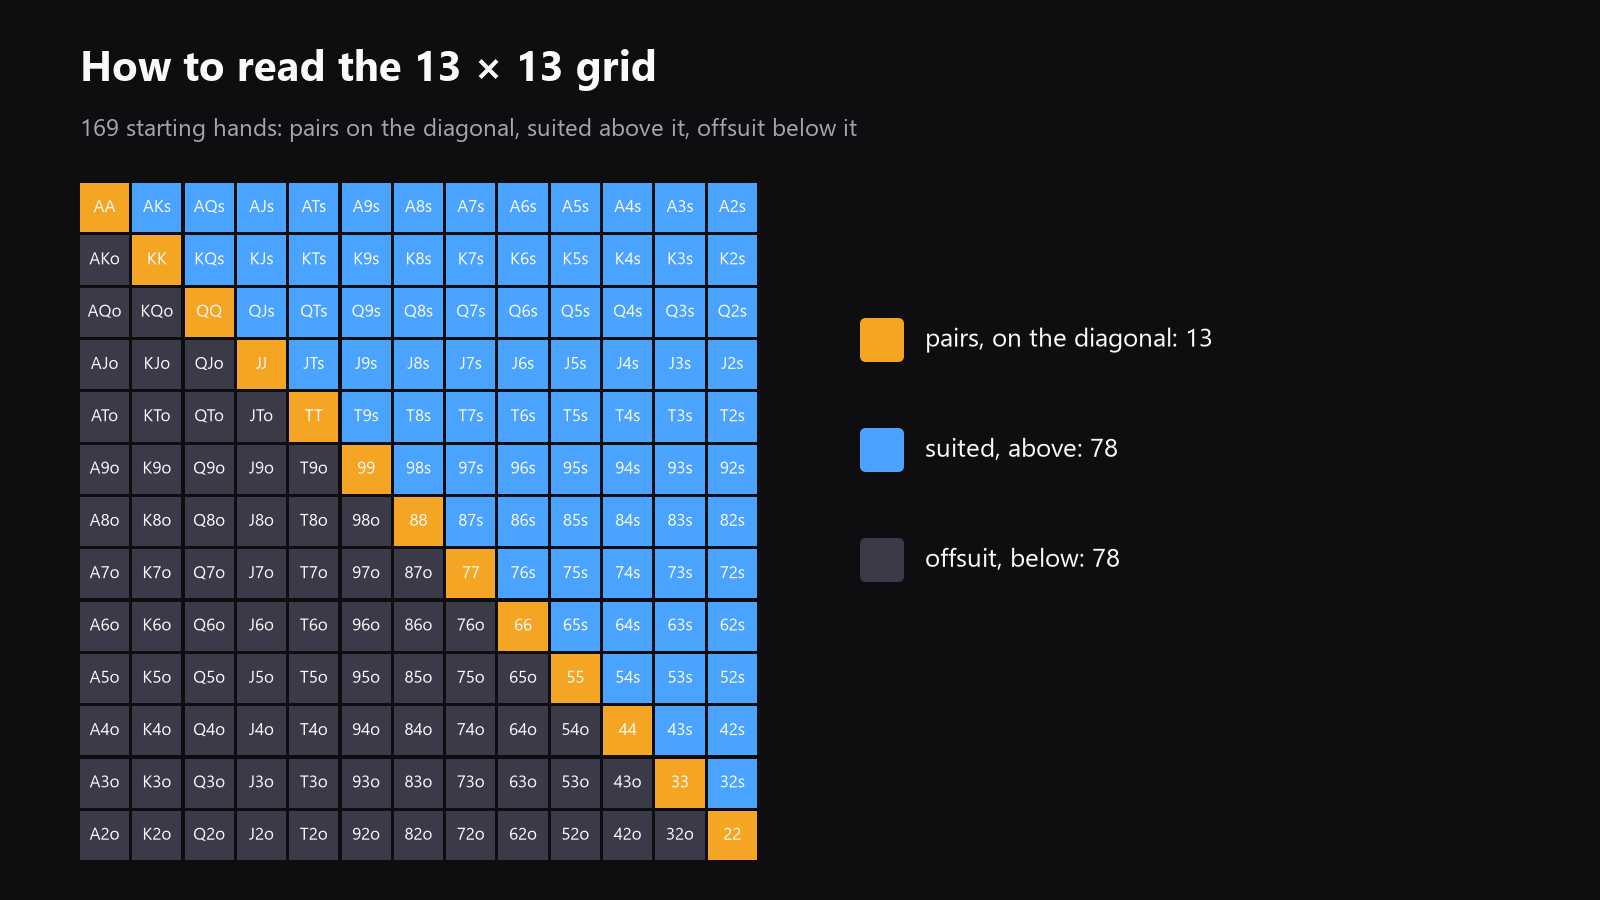
A preflop chart is a map of all 169 starting hand classes in no-limit hold'em.
The 13 ranks run from A down to 2. Put one rank on the vertical axis and one on the horizontal axis, and you get a 13x13 grid:
- pairs on the diagonal: AA, KK, QQ, and so on
- suited hands above the diagonal: AQs, KJs, 76s
- offsuit hands below the diagonal: AKo, KQo, JTo
That simple layout is the whole trick. Once you know where a hand sits, you can read its recommended action quickly.
A chart may use:
- colors for actions
- percentages for mixed strategies
- labels such as open, call, 3-bet, fold, or 4-bet
- size cues, for example "raise 2.5x" or "call"
Some charts are designed for learning. Others are outputs from a solver or an equilibrium tool. Others are simplified charts made by coaches to be easier to memorize. They are not all equally precise, but they all rely on the same logic: given this spot, what is the best action with each hand class?
How to read the grid without getting lost
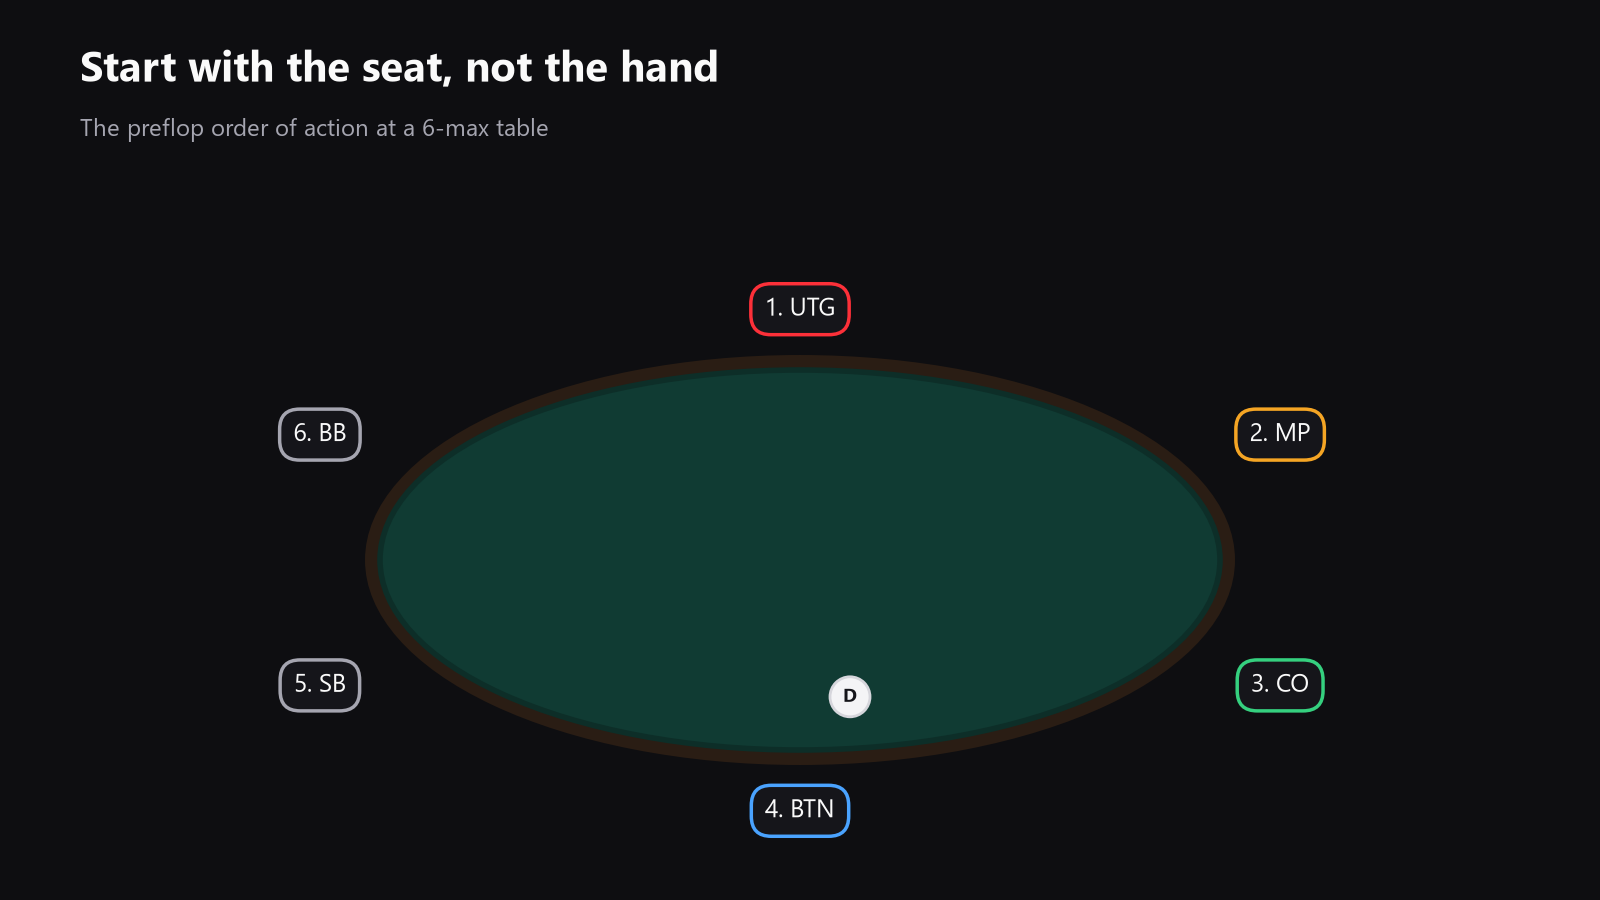
Start with the position, not the hand.
Before you ask whether AJo is a raise or a fold, ask:
- Who acted before you?
- Who is still behind you?
- How deep are the stacks?
- Is this cash, a tournament, or a short-stack spot?
- Is there antes or ICM?
- What size does the chart assume?
If you skip the spot and only look at the hand, you will memorize noise.
A quick way to orient yourself
Suppose you are on the button.
The button has position after the flop, which is a major advantage. A chart for button opens will usually be wide. You will see many more hands played than from early position.
Now suppose you are under the gun.
The same hand, say KJo, can go from a clear open on the button to a fold under the gun. That is not inconsistency. It is the chart doing its job: different spots, different ranges.
Reading the cells
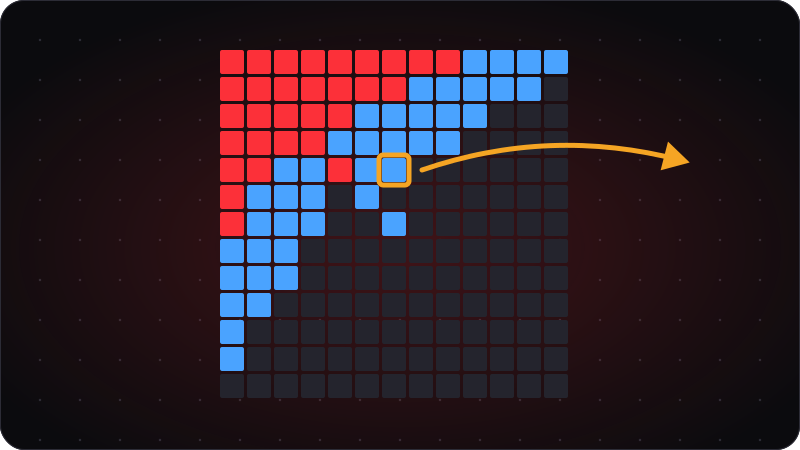
If a cell is pure color, the chart says that action is preferred most or all of the time.
If a cell is mixed, the chart is telling you the hand is close enough that the model uses more than one action.
For example, in one spot you might see a hand like A5s mixing between open and fold. That does not mean the solver is confused. It means the hand sits near the boundary and small changes in assumptions can move it one way or the other.
That is one reason you should not treat a chart as a list of sacred hands. The border hands matter most, because they are the first to move when the table changes.
Where a preflop chart comes from
This is the part players often skip, and it is the part that matters most.
A chart comes from assumptions.
A solver or preflop model does not know your table. It knows a spot that you have described to it:
- position
- stack size
- rake
- open size
- response ranges
- tournament or cash game structure
- sometimes ante, bubble pressure, or ICM
Then it computes a strategy under those conditions.
So when you look at a chart, you are not reading "the truth." You are reading "the answer to this exact version of the question."
That is why two reasonable charts can disagree.
A cash-game chart at 100 big blinds in a high-rake pool may be tighter than a low-rake environment.
A tournament chart near a bubble may be tighter than a chip-EV chart.
A short-stack push/fold chart will look nothing like a deep-stack opening chart.
A chart is only as good as the spot behind it.
How to use charts to learn faster
Charts are not only for memorizing. They are also for learning structure.
If you try to memorize 169 hands as 169 isolated facts, you will forget most of them.
If instead you learn the logic behind the chart, you will remember far more.
1. Learn the shape first
Look at the chart as a pattern, not as a list.
You will usually notice:
- strong hands always play
- pairs behave differently from non-pairs
- suited hands are worth more than offsuit hands
- connected hands gain value when position improves
- weak offsuit hands disappear first from early positions
That shape teaches you what the game rewards.
2. Group hands by family
Do not memorize one hand at a time if you can avoid it.
Learn families:
- all pairs
- suited aces
- broadways
- suited connectors
- offsuit broadways
- weak offsuit gappers
For example, if a chart opens A5s but folds A5o, that tells you something about flush potential, blocker value, and postflop playability. The exact hand matters less than the family relationship.
3. Ask why a hand is in or out
Every inclusion has a reason.
A hand may be played because it:
- makes strong top pairs
- has blocker value
- realizes equity well in position
- can continue against 3-bets
- makes strong draws often enough
A hand may be folded because it:
- is dominated too often
- realizes equity badly out of position
- makes too many weak pairs
- fails to recover its investment after a raise
When you ask why, you learn principles instead of rote memory.
4. Study the border hands
The easiest hands to memorize are the easy ones.
The most useful hands to study are the border hands.
Those are the hands that are close to the cutoff line: ATo, KJo, QTo, small suited aces, medium pairs, suited one-gappers. These are the hands most likely to change when villain tendencies or stack depth change.
If you understand the border, you understand how to adapt.
What charts are good for in real study
A preflop chart helps you build a baseline.
That baseline gives you three advantages:
- you stop inventing ranges from scratch
- you can review your mistakes faster
- you can compare your pool's habits against a known reference
This matters because most players do not need a new fancy strategy first. They need a stable reference that keeps them from drifting.
If you are learning cash games, a chart can tell you what hands belong in your open range from each position.
If you are learning tournaments, a chart can teach you how opening ranges shrink under pressure and widen with antes.
If you are studying short-stack play, push/fold charts become a memory tool for a large number of decisions.
The point is not to worship the chart. The point is to give your study a base layer.
Why a chart is not enough by itself
A chart is built on assumptions about opponents.
That is the part that breaks first in real games.
A model strategy is often designed against a reasonable response range, not against the exact population in your pool and not against the one player sitting in the big blind right now.
In practice, real players do one of three things:
- overfold
- overcall
- overplay hands in predictable ways
That means the best action at the table is often not the chart action.
This is not a flaw in the chart. It is a sign that the chart was never meant to be the final word.
When you should move away from the chart
You should move away from a baseline chart when the table gives you evidence.
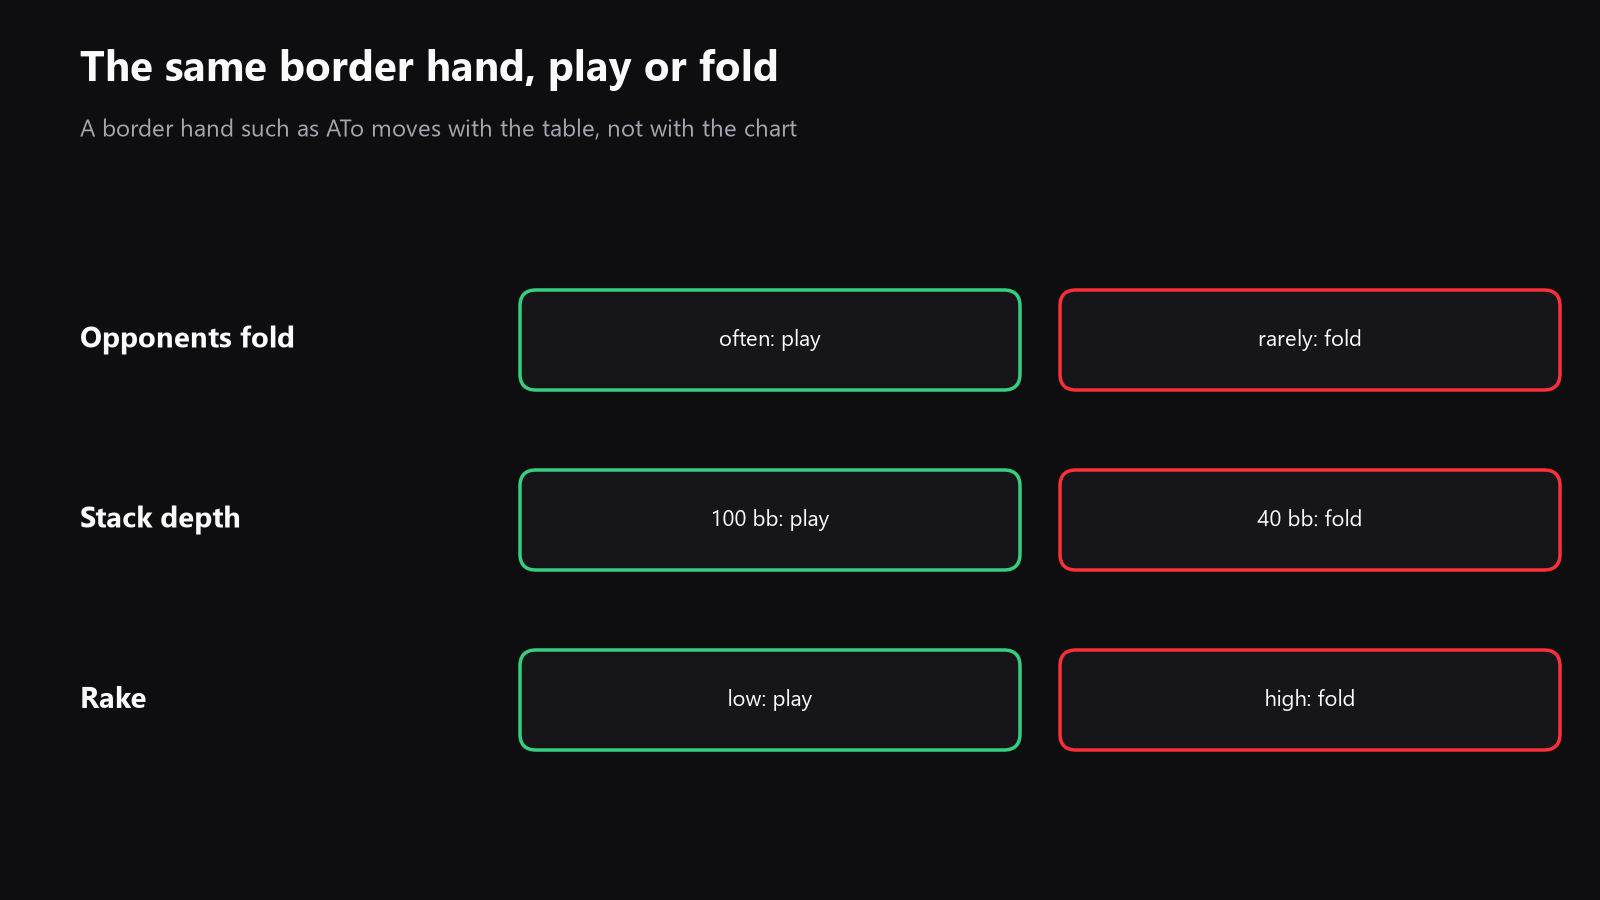
The most common reasons are:
1. The opponent overfolds
If players behind you fold too much to opens, 3-bets, or continuation pressure, you can widen.
A hand that is marginal in theory may become profitable because the table is surrendering too often.
2. The opponent overcalls
If a player calls too much preflop, a bluff-heavy chart becomes less attractive.
Hands that rely on fold equity lose value. Hands with better raw equity and playability gain value.
3. The opponent 3-bets too much or too little
If the player behind you is aggressive, your opening range may need to tighten or your continuing range may need to change.
If the player behind you never attacks, you can often open wider and realize more of your range.
4. Stack depth changes
A hand that is fine at 100 big blinds can become poor at 40 big blinds.
At short stacks, reverse implied odds matter less in one sense and stack commitment matters more in another. Some hands lose value because there is less room to realize their postflop edge. Others gain value because all-in equity matters more than postflop finesse.
5. Tournament pressure changes
In tournaments, ICM changes everything near a bubble, pay jumps, and final tables.
Chip-EV charts are not enough there. A hand that is acceptable in a cash-game style model may become a fold under ICM pressure.
6. Rake is high
Rake can make small pots less profitable.
At micro and small stakes, rake often pushes charts tighter, especially in spots where you would otherwise realize thin edges.
If your room takes a lot out of every pot, some speculative opens and calls stop being worth the trouble.
How to deviate in a disciplined way
The goal is not to freestyle.
The goal is to deviate for a reason.
Use this simple order:
- Start from the baseline chart.
- Ask what the table is actually doing.
- Identify the biggest leak in the spot.
- Change only as much as the evidence supports.
- Review the result after enough hands.
That last step matters. A deviation should be judged after a meaningful sample, not after two pots and a feeling.
A practical example
Suppose your baseline chart says you should open a hand from the cutoff, but the players in the blinds overdefend well and the rake is heavy.
You might narrow your opening range, especially around the weakest offsuit hands.
Now suppose the blinds are passive and overfold to pressure.
The same chart can support a wider opening range, because the extra fold equity pays for the marginal hands.
The chart did not fail. It simply sat at the center of a decision that depends on the table.
A good way to study charts without memorizing nonsense
Here is a method that works well.
Step 1. Pick one spot
Do not study all preflop charts at once.
Pick one spot only:
- UTG open
- BTN open
- SB defend
- BB vs BTN
- 3-bet versus open
- short-stack push/fold
Step 2. Learn the top and bottom of the range
Find the strongest hands and the weakest hands that still continue.
This gives you the shape of the range and its boundaries.
Step 3. Study the mixed hands
The mixed hands tell you where the spot is sensitive.
If a hand mixes between actions, ask what changes it one way or the other.
Step 4. Compare a few similar spots
Compare UTG versus CO, or BTN versus SB, or 100 big blinds versus 40 big blinds.
You will see how position and depth reshape everything.
Step 5. Test the chart against your own hands
This is where the study becomes real.
Review your own sessions and ask:
- did I follow the baseline?
- was my deviation justified?
- did I deviate because the table was weak, or because I was guessing?
That is the bridge between theory and results.
How a chart helps you review your leaks
A chart is not only for preflop play. It is also a diagnostic tool.
If you keep losing money in early position, a chart helps you check whether you are opening too wide.
If you lose value in the blinds, it helps you see whether you defend too much or too little.
If you struggle against 3-bets, it helps you compare your continuing range with a more stable baseline.
If you want to go further, use a tool that measures your actual frequencies and compares them with the field. That way you can see whether the leak is real, whether it is expensive, and whether it is just variance.
The point is not to obey a chart forever. The point is to build a baseline, then compare reality against it.
What a good preflop chart does not do
A chart does not:
- know who is at your table
- know the current mood of the pool
- know whether one opponent is a calling station or a nit
- know whether you are under ICM pressure
- know whether the rake is crushing thin edges
- know whether your line is part of a larger exploit
That is why chart study should end in adjustment, not obedience.
A simple rule of thumb
If you are learning, use charts to build discipline.
If you are playing against unknowns, use charts to stay grounded.
If you are playing against repeated opponents, use charts as the baseline you deviate from when the evidence is strong enough.
That is the right sequence.
Baseline first. Exploit second. Guessing last.
Where Poker Exploit fits in
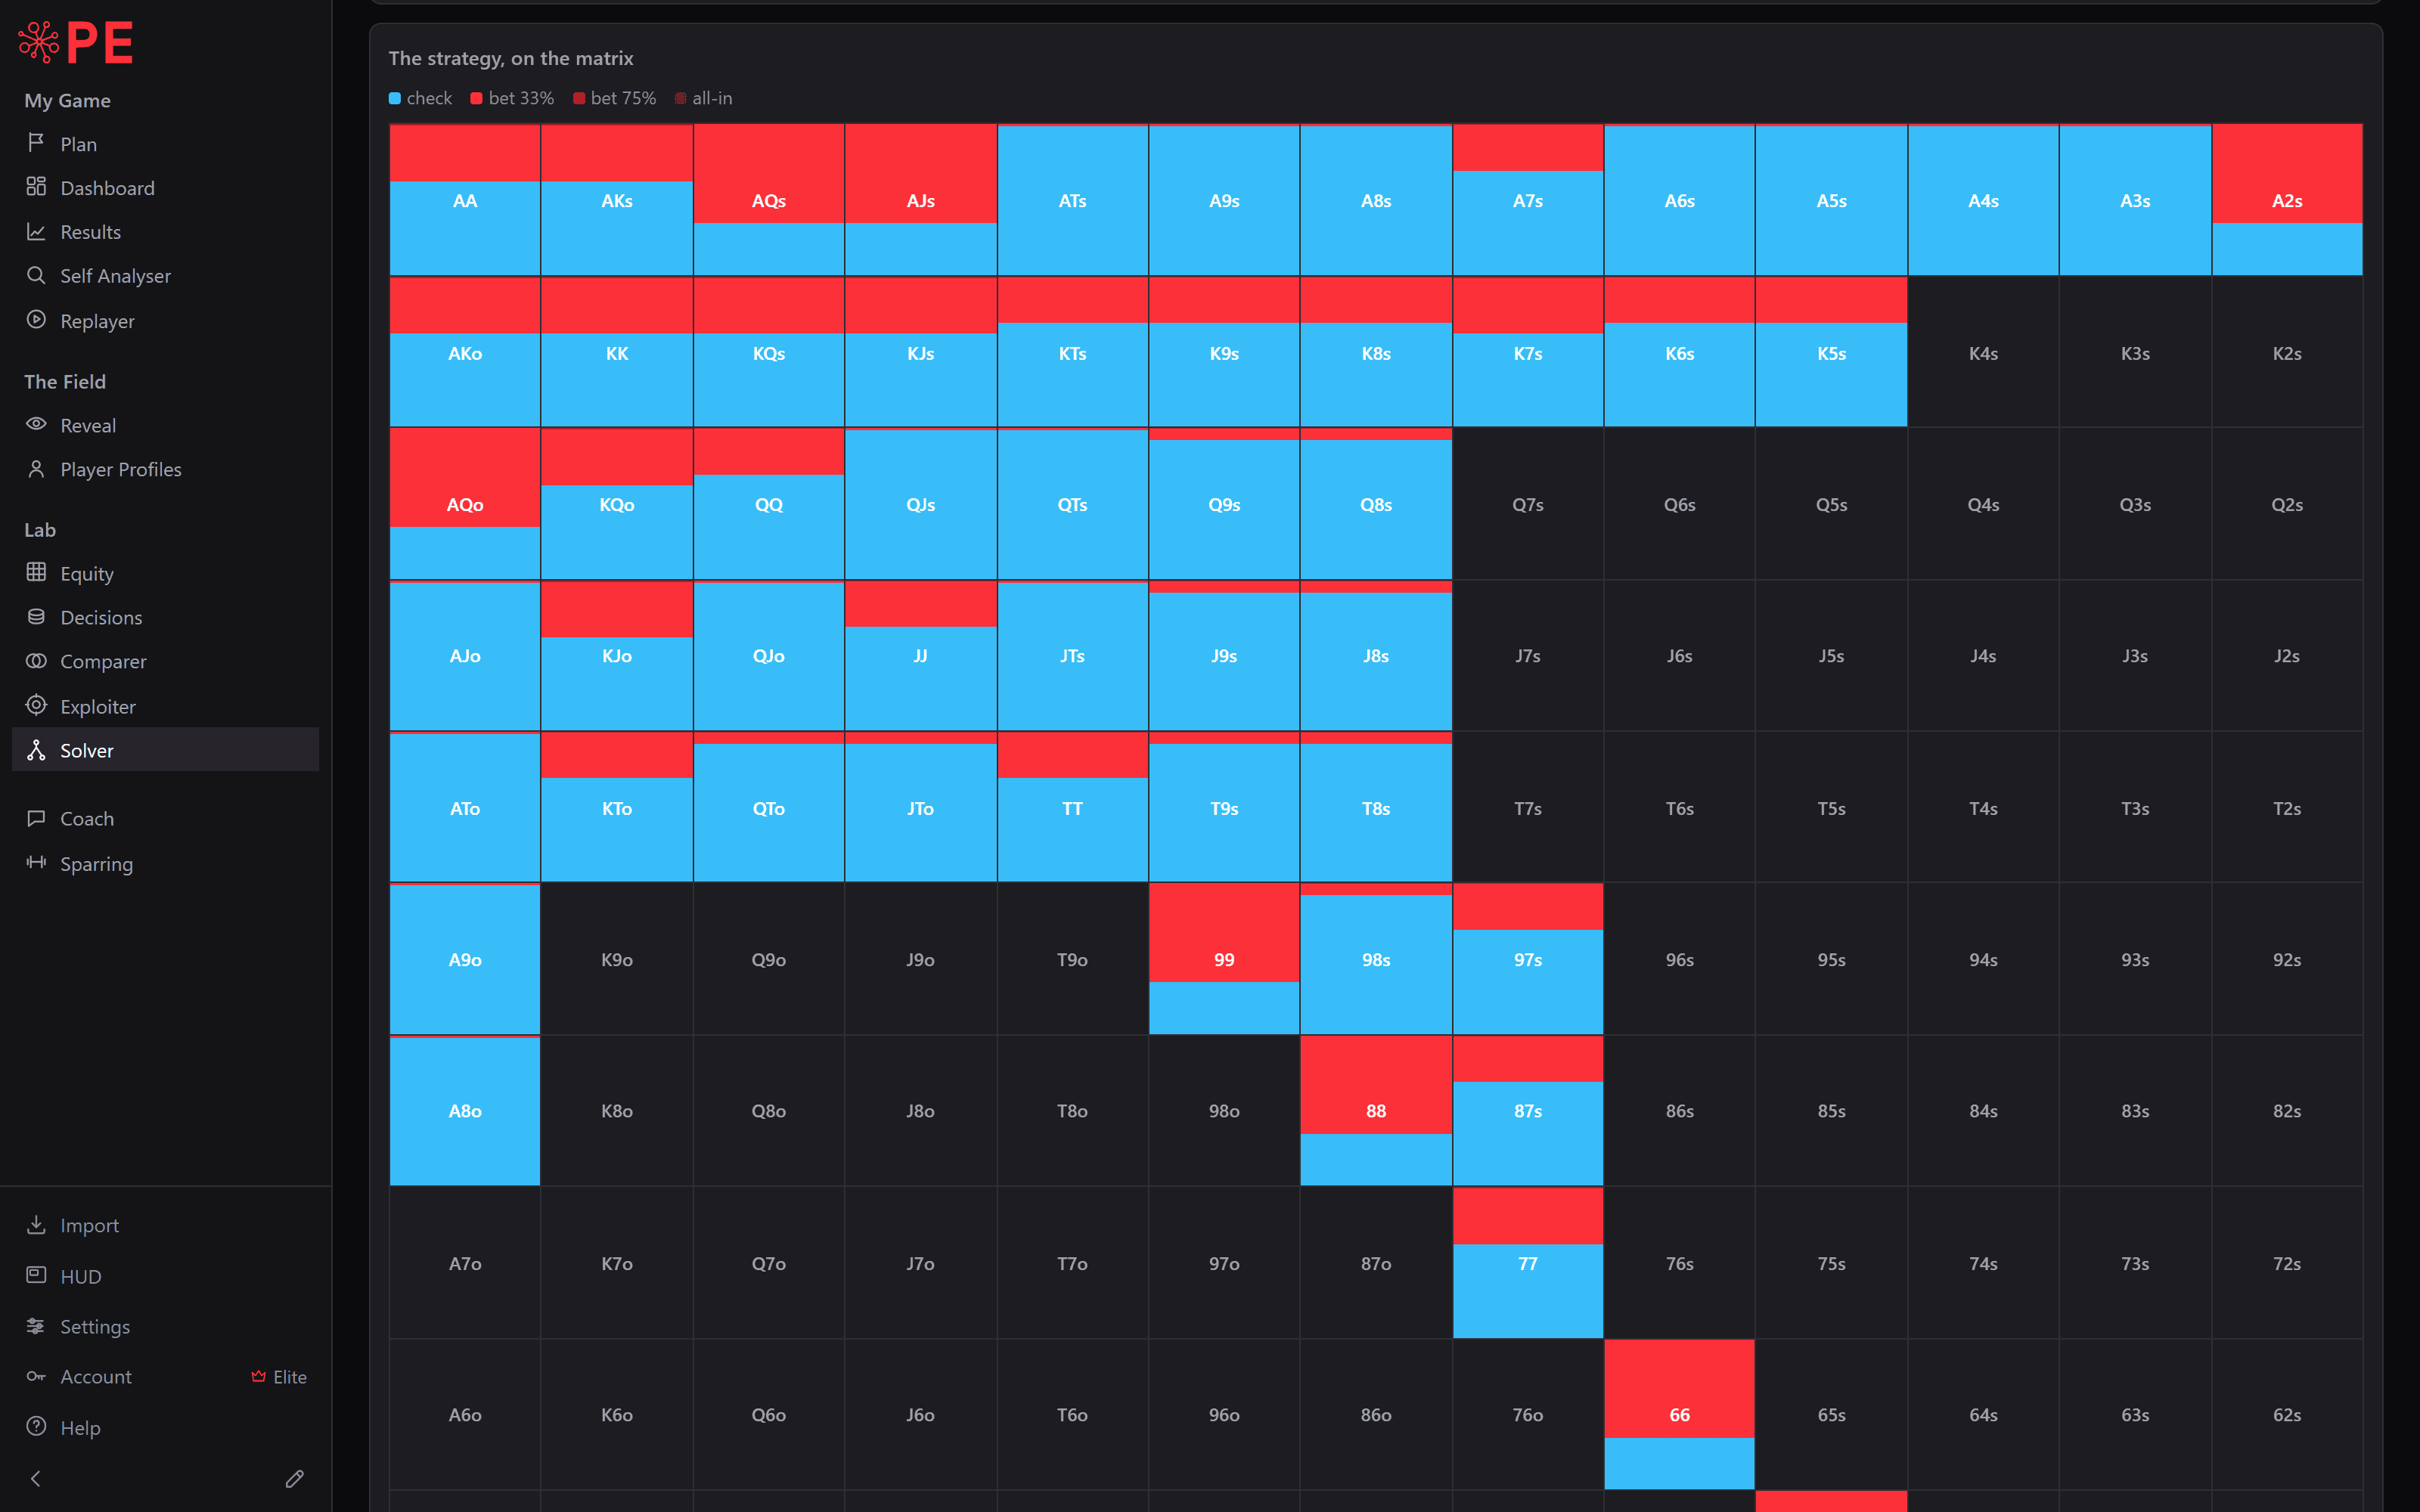
If you want to study a preflop spot more seriously, the Solver module gives you a strategy grid for a defined situation, and the Decisions module gives you push or fold answers for short-stack spots.
That matters because you are not just looking for a chart to copy. You are looking for a way to understand where it comes from and how far your real games drift from it.
Once you compare the baseline with your own hands and with what the field actually does, the chart stops being a memorization aid and becomes a decision tool.
That is the part most players never reach.
The shortest useful summary
A preflop chart is a map, not a law.
Learn it to understand structure, position, and hand families.
Use it to build a baseline.
Then leave it behind whenever the table, the stacks, the rake, or the tournament situation makes a different action better.
If you can do that, you are not just following charts. You are using them the right way.
Do it on your own hands.