
If you play tournaments, your graph can lie to you for a long time.
That is not because the graph is broken. It is because tournament poker is one of the swingiest formats in the game. A few deep runs can make a month look brilliant. A long stretch of average finishes can make a winning player look lost. If you want to know whether you are actually doing well, you need more than a green line and a good feeling.
The two first numbers to learn are ROI and ITM.
- ROI means return on investment.
- ITM means in the money.
They sound simple. They are simple. But they are also easy to misunderstand.
What ROI means in tournament poker
ROI tells you how much profit you made compared with what you paid to play.
The formula is:
ROI = (prizes won − total cost to enter) / total cost to enter
And total cost to enter means buy-in plus fee.
Example:
- You enter 500 tournaments at $10 + $1.
- Your total cost is 500 x $11 = $5,500.
- You cash for a total of $6,050.
Your ROI is:
(6,050 - 5,500) / 5,500 = 0.10, or 10% ROI
That is the number most players mean when they say, “What is my ROI?”
It is a better measure than raw profit, because it tells you whether your result is good relative to the money you put at risk. A $500 profit on $2,000 of buy-ins is very different from a $500 profit on $20,000 of buy-ins.
What ITM means
ITM is the share of tournaments you finish in the money.
If you play 200 tournaments and cash 34 times, your ITM is 17%.
That sounds useful, and it is, but only up to a point. ITM tells you how often you survive to a paid place. It does not tell you how much you won when you cashed.
That is the first trap.
A player can have:
- a high ITM and a poor ROI, if most of the cashes are tiny
- a modest ITM and a strong ROI, if the cashes are deep and the final tables are big
So if you only look at ITM, you may think you are doing well when you are not. Or the opposite.
Why tournament variance is so huge
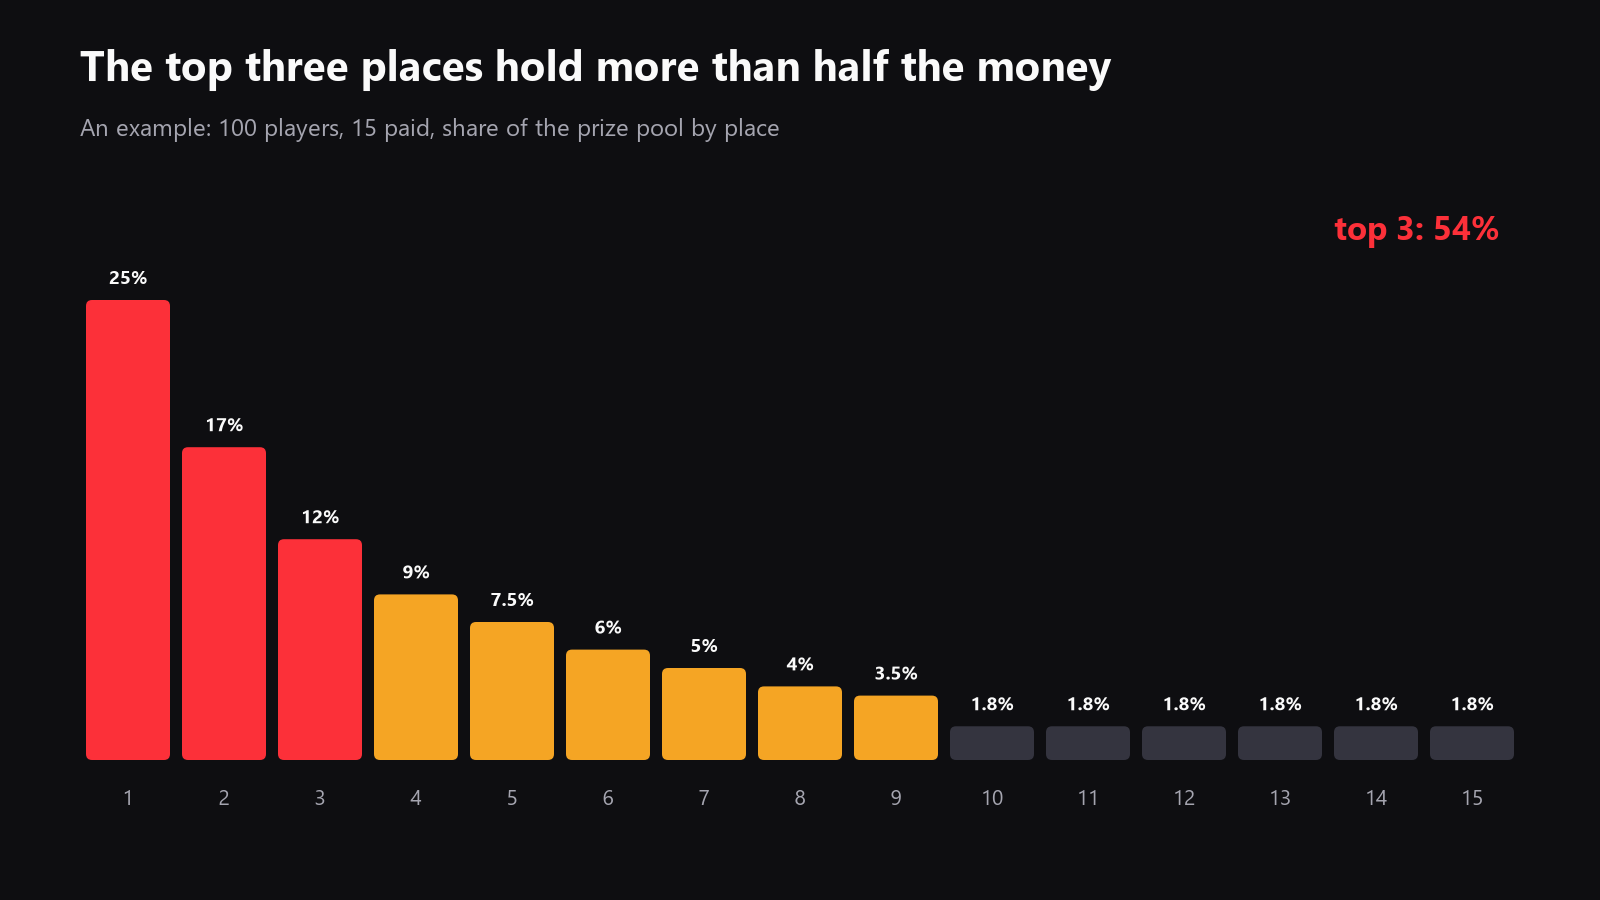
Tournament payouts are top heavy.
That is the entire problem.
In cash games, if you win a big pot, you keep that money immediately. In tournaments, most of the prize pool is concentrated in a small number of finishes. The difference between 27th and 7th can be massive. The difference between 2nd and 1st can be massive again. And the money from one win can outweigh dozens of min-cashes.
That means your result is driven by rare events.
A simple example:
- You play 1,000 tournaments.
- You cash often enough to keep your ITM looking decent.
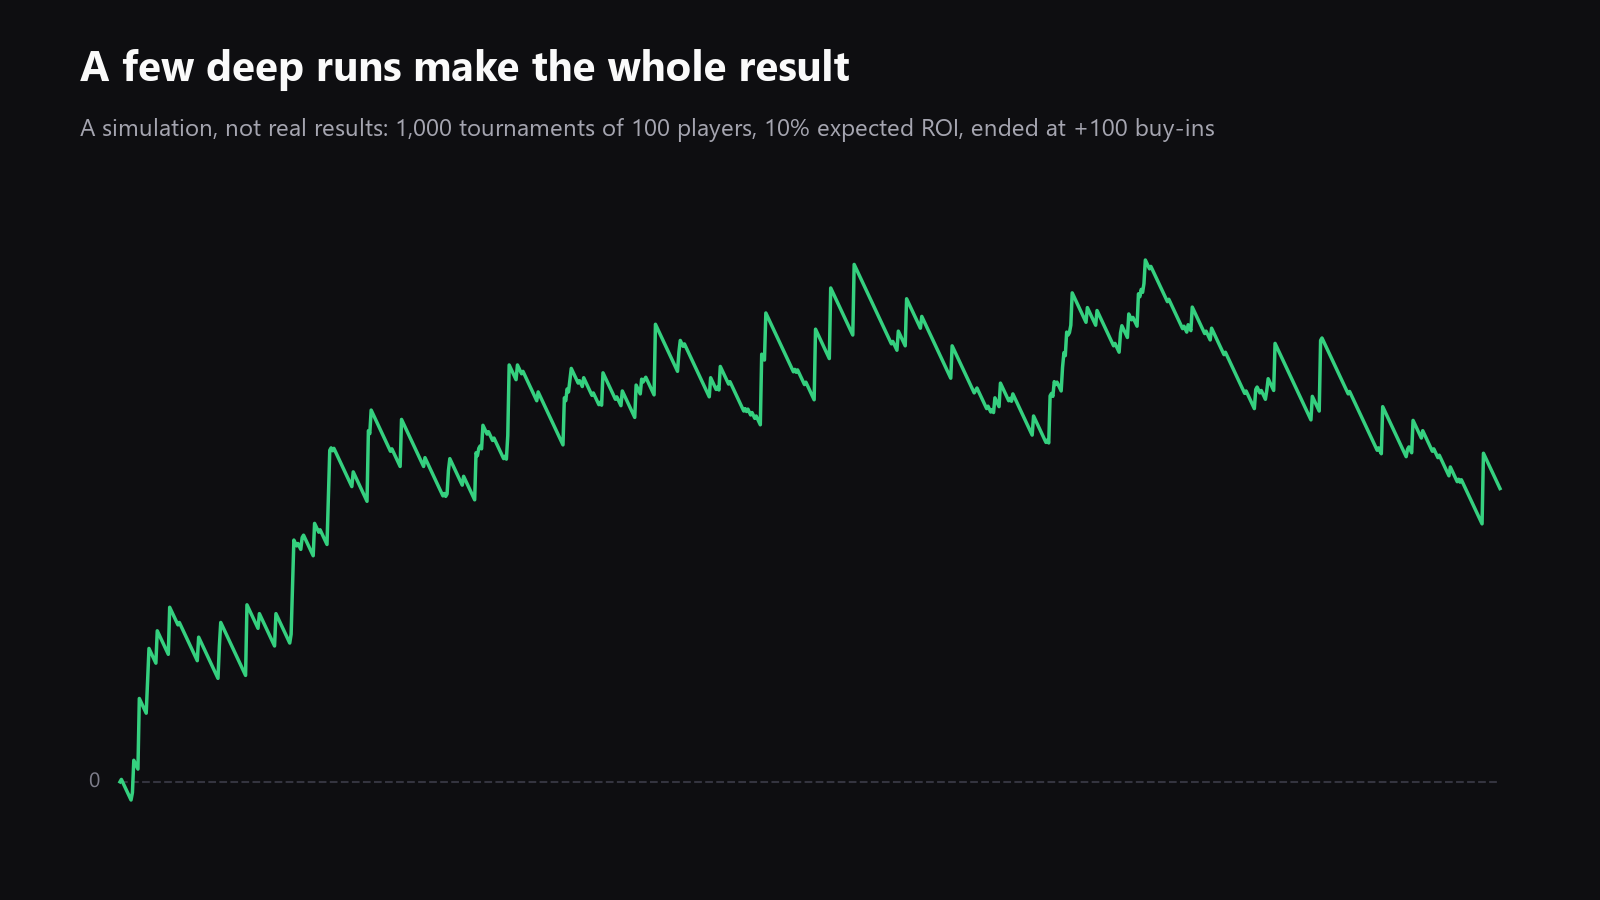
- But most of your profit comes from 3 or 4 deep runs.
That is normal. It is not a bug in the format. It is what makes tournament poker both profitable and brutal.
This is why a player can run below expectation for months and still be a winning player, and why another player can run above expectation for months without having a real edge.
One deep score can erase a long downswing. One long downswing can bury a real edge.
What a good ROI looks like
There is no universal “good ROI” number.
It depends on:
- field size
- rake
- format
- average skill of the field
- re-entry structure
- bounty structure
- your own ability to survive late-game spots
Still, you can think about it like this:
- In tougher online MTTs, especially large-field ones, a single-digit ROI can already be very strong.
- In high-rake, tough, or very large fields, even a positive ROI is valuable.
The key point is not the exact percentage. The key point is whether you are beating the game after rake, and whether that edge is real enough to survive variance.
Also, do not confuse good ROI with good short-term results.
A player can run badly and still have a strong ROI in the long run. A player can run well and still be unprofitable in the long run.
That is why the sample matters.
How many tournaments do you need before a result means something?
More than most players think.
A few dozen tournaments tell you almost nothing. A few hundred tournaments tell you something, but not much. Even a thousand tournaments may still leave you with a very noisy picture, especially in large-field events.
Why? Because your result is not made of a smooth stream of equal outcomes. It is made of a small number of important events:
- min-cashes
- decent runs
- final tables
- top 3 finishes
- wins
If those events do not happen yet, or if they happen at the wrong time, your graph can be far away from your true level.
So what should you do?
Use your volume to ask a better question:
- Is my ROI positive over enough tournaments to matter?
- Is my ITM stable, or just the product of a few tiny cashes?
- Are my deep runs frequent enough to support my result?
- Am I improving in the spots that create big payouts?
A result starts to mean something when it survives enough hands and enough tournaments that your deep runs are not doing all the work by luck.
Why ITM can mislead you
ITM is useful, but it is not enough.
Imagine two players.
Player A
- ITM: 14%
- Few cashes, but several final tables
- Strong ROI
Player B
- ITM: 28%
- Many min-cashes
- Almost no real depth
- Weak ROI
Player B looks better if you only stare at ITM. But Player A is the one actually making money.
That is why ITM should be read with other stats, not alone.
It is especially important in formats like:
- PKOs
- re-entry tournaments
- very top-heavy fields
In bounty formats, for example, a lot of your value can come from bounties rather than pure cashing frequency. A naked ITM number can hide that.
The most useful numbers to track besides ROI and ITM
If you want a better picture of your tournament game, track more than the final result.
Here are the numbers that help most:
1. Average buy-in
If your average buy-in rises, your ROI may fall even if your game is unchanged. You need to know what stake level your sample actually represents.
2. Field size
A 5% ROI in small fields is not the same as a 5% ROI in huge fields. Bigger fields usually mean more variance and more payout concentration.
3. Final tables
Final tables matter a lot because they are where most of the money sits. Count them. Track them by format.
4. Top 3 finishes and wins
These are rare, but they explain a huge part of tournament profit.
5. ROI by format
Track separately:
- freezeouts
- re-entries
- PKOs
- turbos
- satellites
- satellites with different target payouts
A player can be strong in one format and weak in another.
6. Decisions by stage
Look at where you are losing or winning:
- early stage
- middle stage
- bubble
- late stage
- final table
Track decisions, and chips and big blinds won and lost, by stage. Late-stage decisions matter much more than many players realize.
7. Cashes versus deep runs
If you cash often but never go deep, your ITM may look fine while your profit stays weak.
8. Stack depth situations
Your play with 10 big blinds is not the same as your play with 40 big blinds. A good tournament tracker should help you separate those spots.
9. Bounty won, if you play PKOs
In PKOs, the bounty side of the result is part of the truth.
10. Leaks, not just results
A profitable sample can still hide big mistakes. You need to know what to fix, not just whether the line is up.
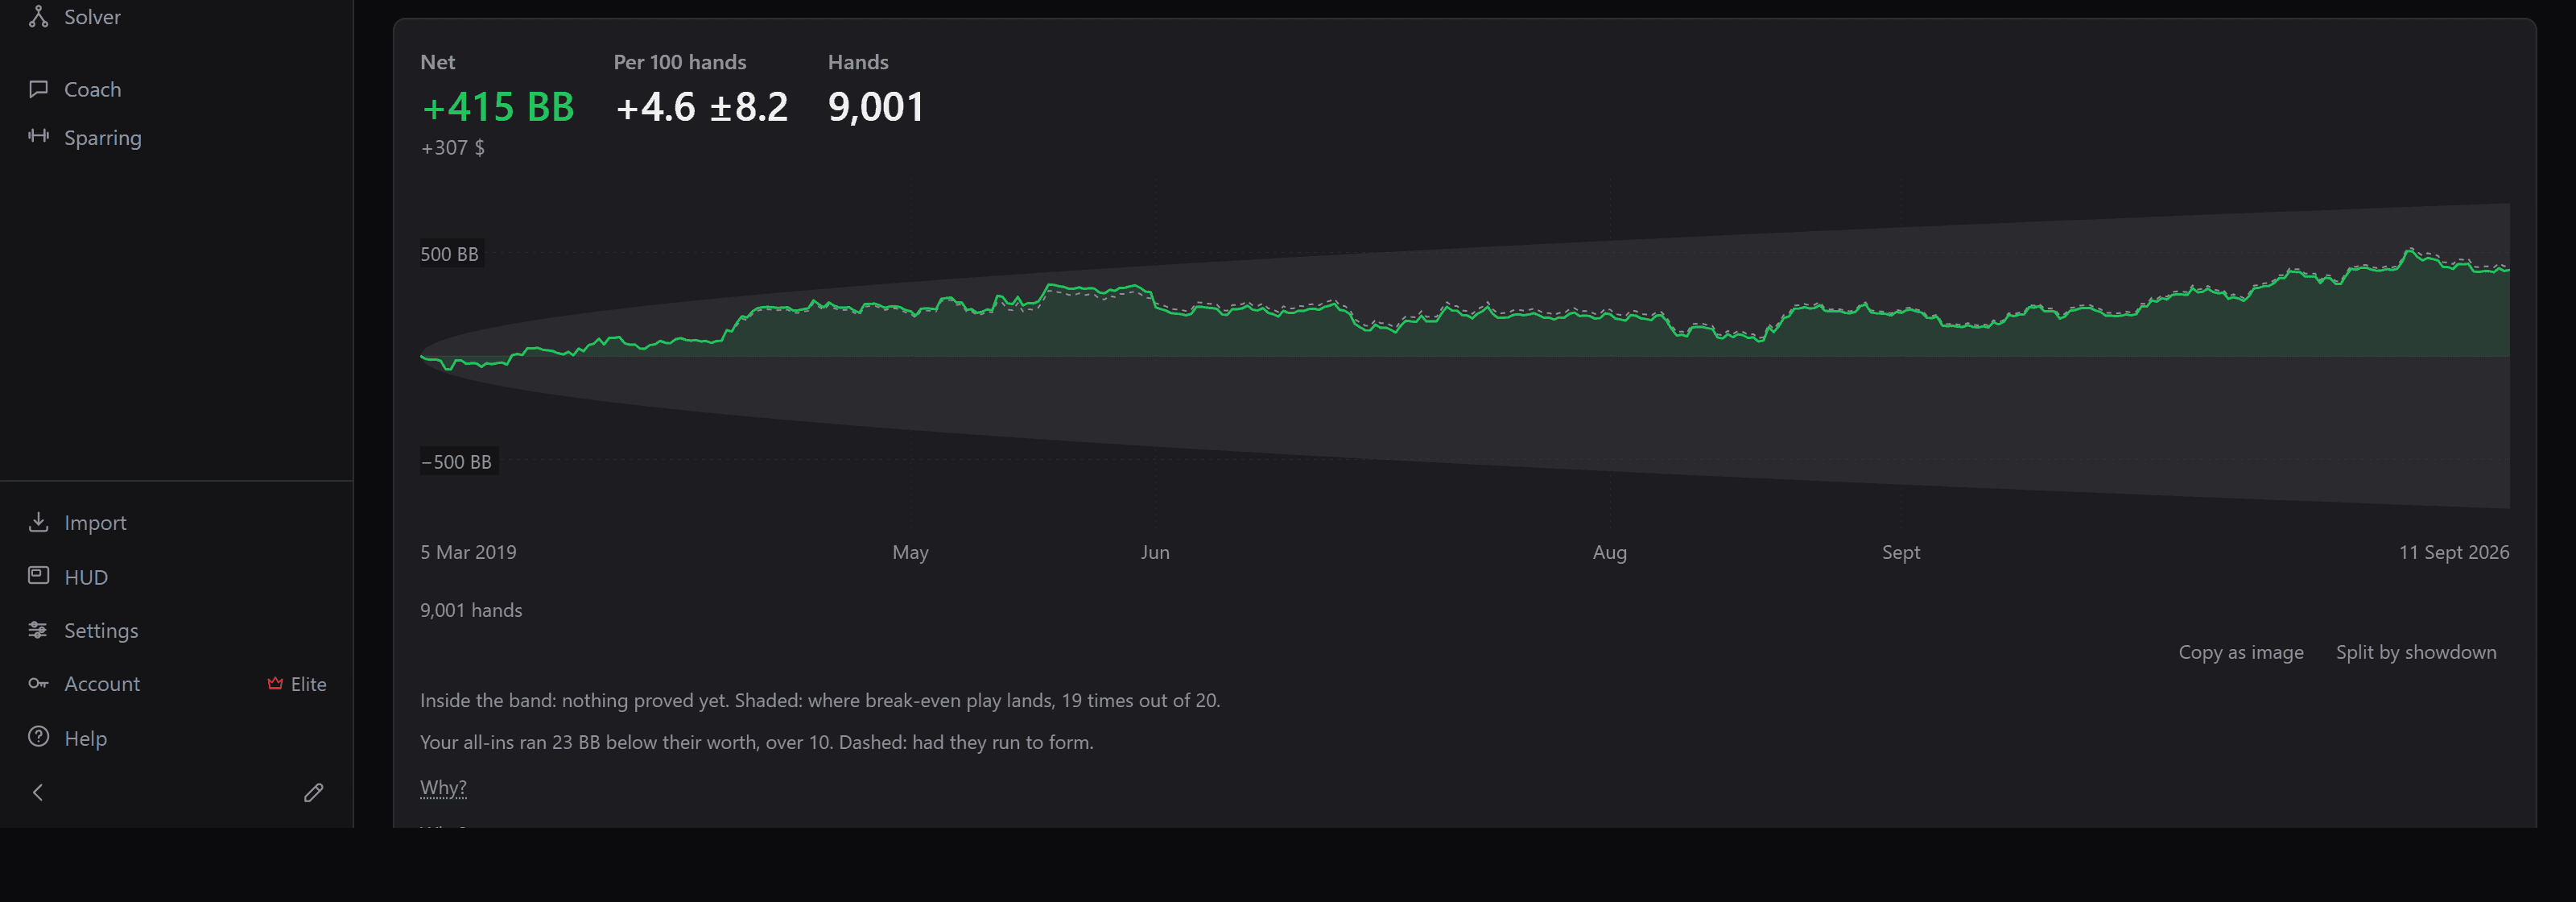
This is where study tools matter. In Poker Exploit, the Results module shows your tournament ROI and ITM, while the Reveal module shows what players at your limits actually do in tournament spots, and the Decisions module gives push, fold, or call charts for short stacks. That way, you do not just look at the result, you can also see where it comes from.
How to read a tournament graph without fooling yourself
A good way to think about your graph is this:
- A rising line does not automatically mean a real edge.
- A falling line does not automatically mean you are a losing player.
- A flat line over a small sample does not tell you much.
- A graph becomes useful when you can connect it to the quality of your decisions and the size of your sample.
So if your ROI is negative after 200 tournaments, do not panic. If your ROI is positive after 200 tournaments, do not celebrate too early.
Ask instead:
- How many deep runs did I have?
- How top heavy is the format?
- Am I beating the field after rake?
- What part of my game is actually producing the money?
That is the correct way to read tournament results.
The short version
If you remember only a few things, remember these:
- ROI tells you how much profit you make relative to what you pay.
- ITM tells you how often you cash, not how well you cash.
- Tournament variance is huge because most of the money sits in rare deep runs.
- A good ROI depends on field size, rake, and format.
- Small samples can be wildly misleading.
- Track final tables, top 3s, average buy-in, field size, format, and stage, not only the final result.
If you want to know whether you are actually improving in tournaments, do not judge yourself by one score, one month, or one lucky final table. Judge yourself by a sample large enough to survive the noise, and by the quality of the spots that create your profit in the first place.
Do it on your own hands.